Prototyping Next-Generation Accessibility Tools with Bloomberg
In the Media
Over the last two years, Bloomberg’s UX team has partnered with Carnegie Mellon University Master of Human-Computer Interaction program and visually impaired users to prototype next generation accessibility tools.
At Bloomberg, there’s a mantra that speaks to the design philosophy and values of every UX team member: “I am not the user.” It’s a phrase you will invariably hear recited daily by team members – a constant reminder that users have unique needs different from those doing the designing.
No project better embodies this idea than an ongoing partnership between Bloomberg and the Human-Computer Interaction Institute at Carnegie Mellon University to explore ways to make financial data more accessible to those with visual impairments. Over the last two years, the master’s students working with Bloomberg have been tasked with using UX design and technology to explore how a gradual or congenital loss of eyesight impacts people’s ability to find employment in the financial sector – and to create tech-driven accessibility prototypes that help users “see” financial data non-visually.
Hearing is believing
Two different Carnegie Mellon teams have created two unique prototypes, each tackling a different user need related to helping someone with vision loss read charts.
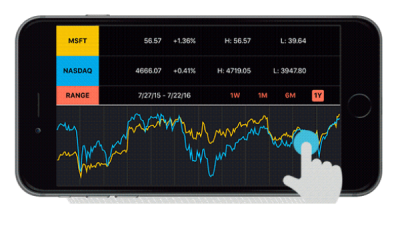
In 2016, one of the teams created Sonify, an iPhone application that enables individuals with visual impairments to quickly understand line graphs. The app makes use of sonification techniques to help users “listen” to the curve of a stock trendline and get a sense of change in stock prices over time. This was an attempt to enable users with all visual capabilities to get a gist of a stock’s performance.
Building on Sonify, the team in 2017 focused on creating a tool to help non-sighted users get information about stock prices in context. That team created Stockgrok, an accessible web-based chart analysis tool for making buy or sell decisions through sound. With Stockgrok, the team focused on using auditory counterparts to visual cues in charts, such as helping a user hear the distance between two lines, the intersection points and price positions above or below a 50-day moving average.
Read the full article on the Bloomberg UX blog: How to convey financial charts for users without sight? Bloomberg’s UX designers explore visual data through sound
Related People
Skip Shelly