Construction Junction (CJ), a local organization that promotes conservation through the sale of used and surplus building materials, asked us to examine the reuse sector, identify problems, and find opportunities where technology could make reuse more convenient.
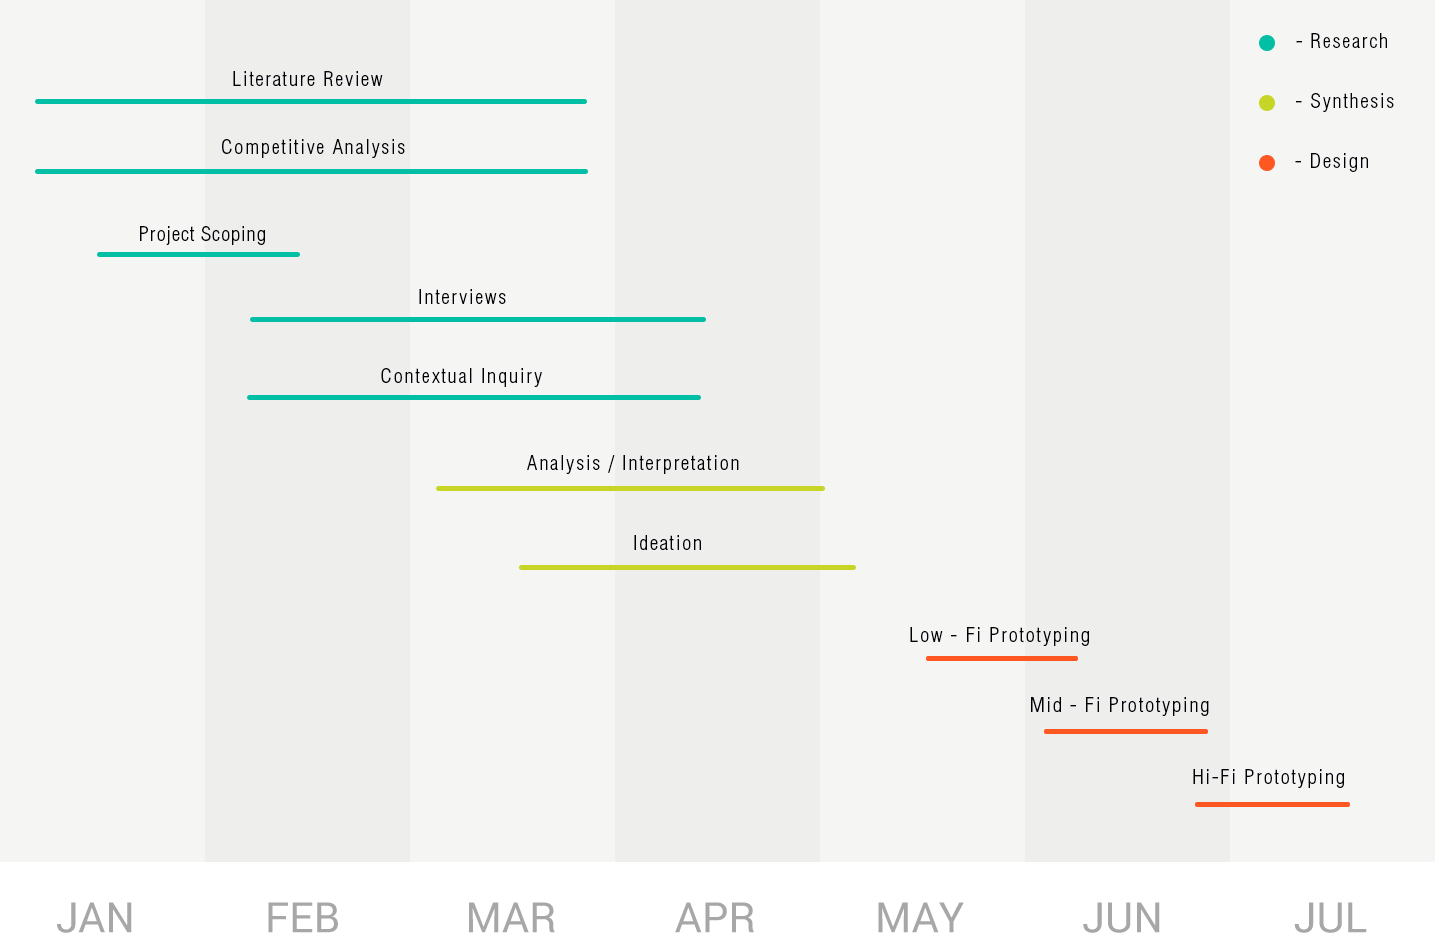
This capstone project was completed in two phases: the discovery phase and the design phase. The goal of the discovery phase was to understand the current state of the reuse marketplace. To do this, we visited fifteen reuse organizations to see how they manage inventory and customer relationships, read articles about reuse, and then synthesized this information into key findings. The design ideas that came from these findings drove the exploration of design ideas in phase two.

Through environmental and economic reports, we learned how reuse works, why people and organizations engage in reuse, and how reuse affects the economy, the environment, and individuals.

Our analysis mapped 35 attributes across 12 reuse organizations. We learned that all reuse organizations maintain partnerships with other organizations, that most rely on volunteers for some portion of their labor, and none address their inventory management needs as well as first-use organizations.

We performed contextual inquiries with employees at CJ and other reuse organizations, watching them enter items into inventory, process and price items, and perform other daily inventory management tasks.

We interviewed or visited 15 mostly local reuse organizations across 7 domains of reuse: building materials, clothing and housewares, medical supplies, arts and crafts, educational materials, food, and books.
Organizational visits
Hours of contextual inquiry
Articles reviewed
Notes
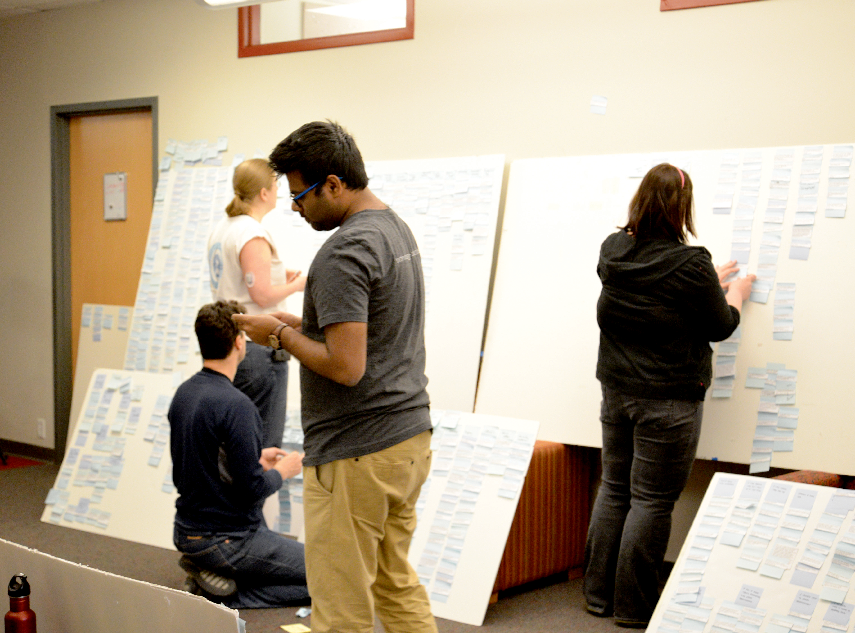
We used affinity diagramming to understand the wealth of data that we collected through contextual inquiry, interviews, and visits. We also discovered which values and procedures these organizations share and how reuse organizations differ.
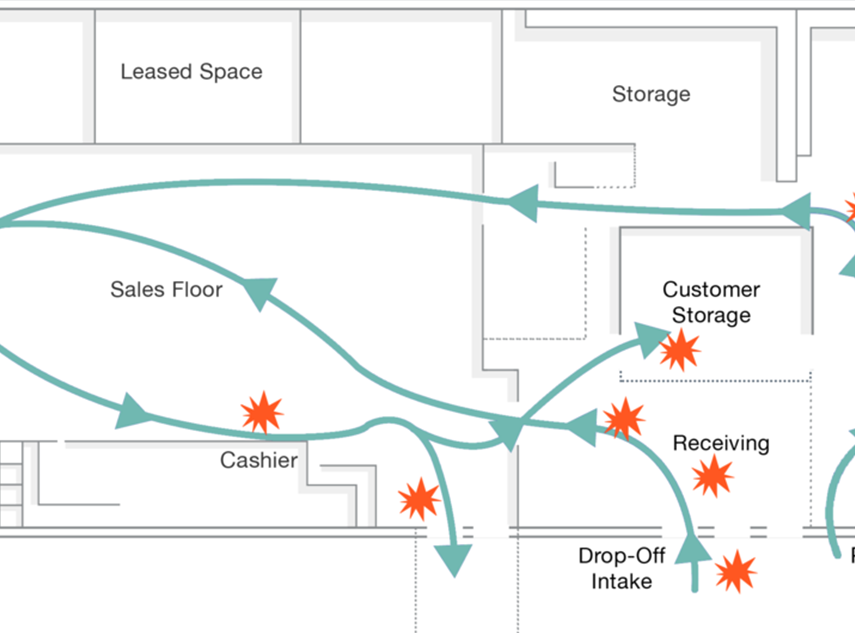
Based on the contextual inquiries we performed with CJ employees, we mapped the flow of items through CJ’s warehouse and noted each place where we observed breakdowns in the process.
"This is about more than reusing things people throw away. This is an economic development strategy. The more material we intercept, the more material we put in the marketplace, the more people we employ." - Mike Gable, CEO of Construction Junction.

Donors don't know where to take their used goods and have a hard time transporting those goods to donation centers because of limited hours, the size of items, and organizational restrictions on what to accept. Compared to simply throwing items away, donation is difficult.

Getting donations from drop-off to the sales floor is labor-intensive. Each donated item is unique, and each one must be priced and, perhaps, added to an inventory database. Decisions made at the intake step cost organizations money in processing costs, disposal costs, or simply through wasted space on the sales floor for items that are hard to sell.

The appearance and organization of reuse stores often doesn't compare favorably with their first-use counterparts. Smaller budgets often mean fewer services, like pick-up and delivery, which are offered by first-use stores.

Smaller budgets also impact the use of technology in reuse marketplaces. Few have online stores and few keep track of inventory using database software. These organizations lack the technical expertise and budget for technology that can drive sales and help inform business decisions.

While immersed in the data synthesis, we used brainstorming to develop visions that could be used to solve problems we observed in our research. These visions were then placed in a feasibility matrix, to evaluate their usefulness and implementation difficulty. This evaluation helped cull the field of ideas proposed for further development.

Storyboards of the best ideas were developed to take back to reuse organizations to gauge their interest and gather further feedback. Storyboards helped the team decide which candidate would be developed into a final prototype.
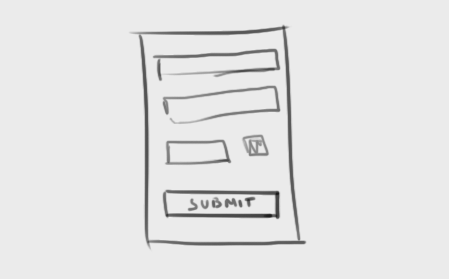
A quick sketch of our idea on paper validates general service and interface ideas.

Interactive wireframes have clickable areas to mimic functionality. This prototype tested interface usability.
This refined visual interface shows only core functionality and tested both the service in-situ and interface usability.