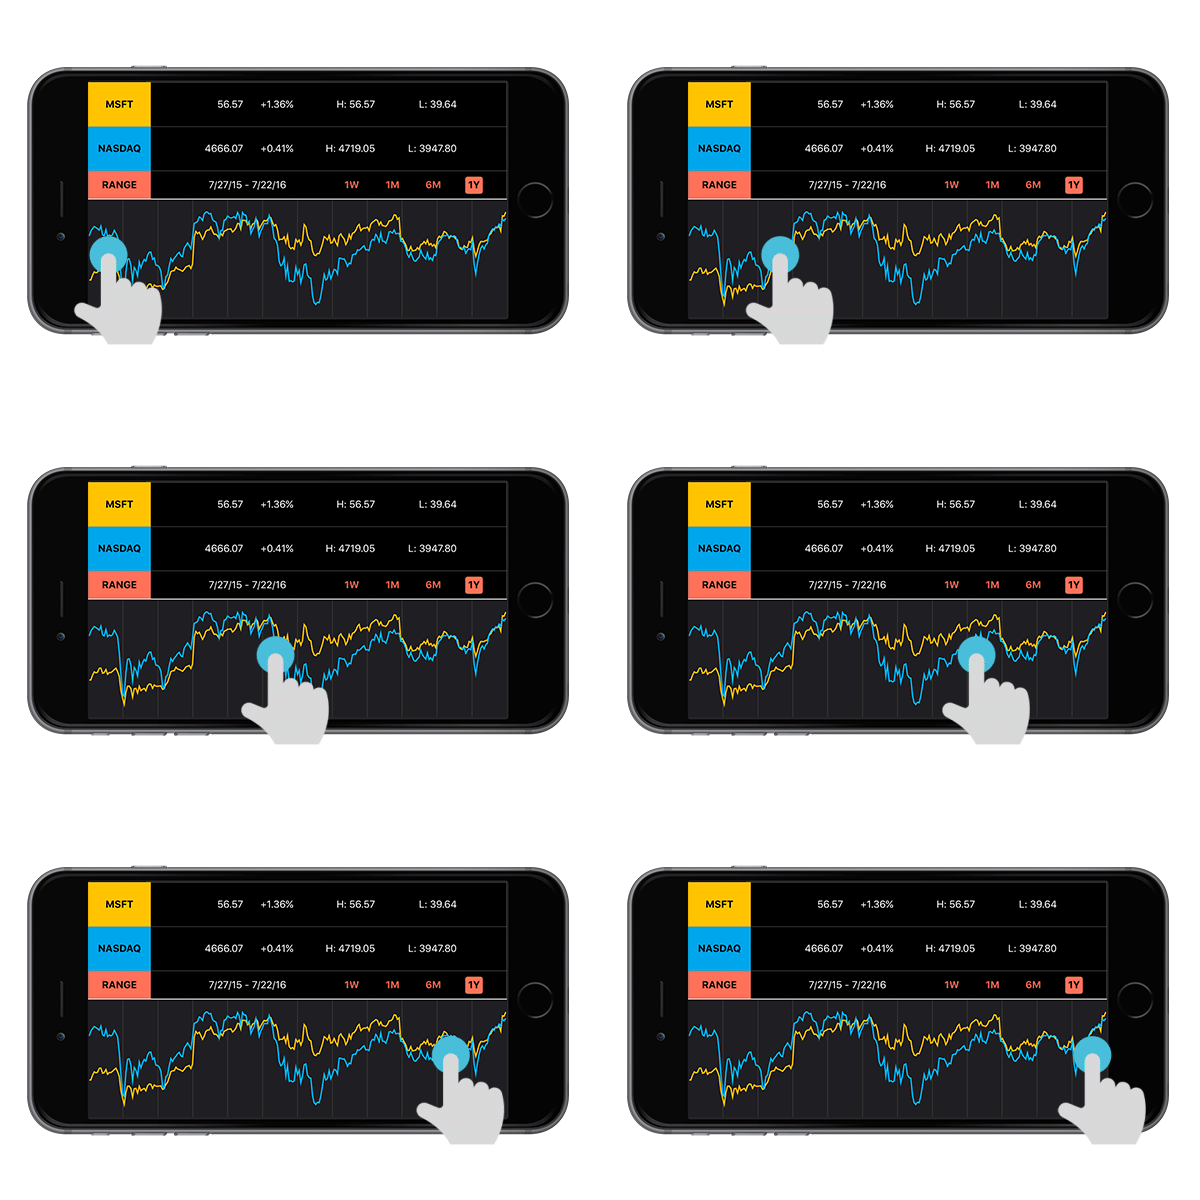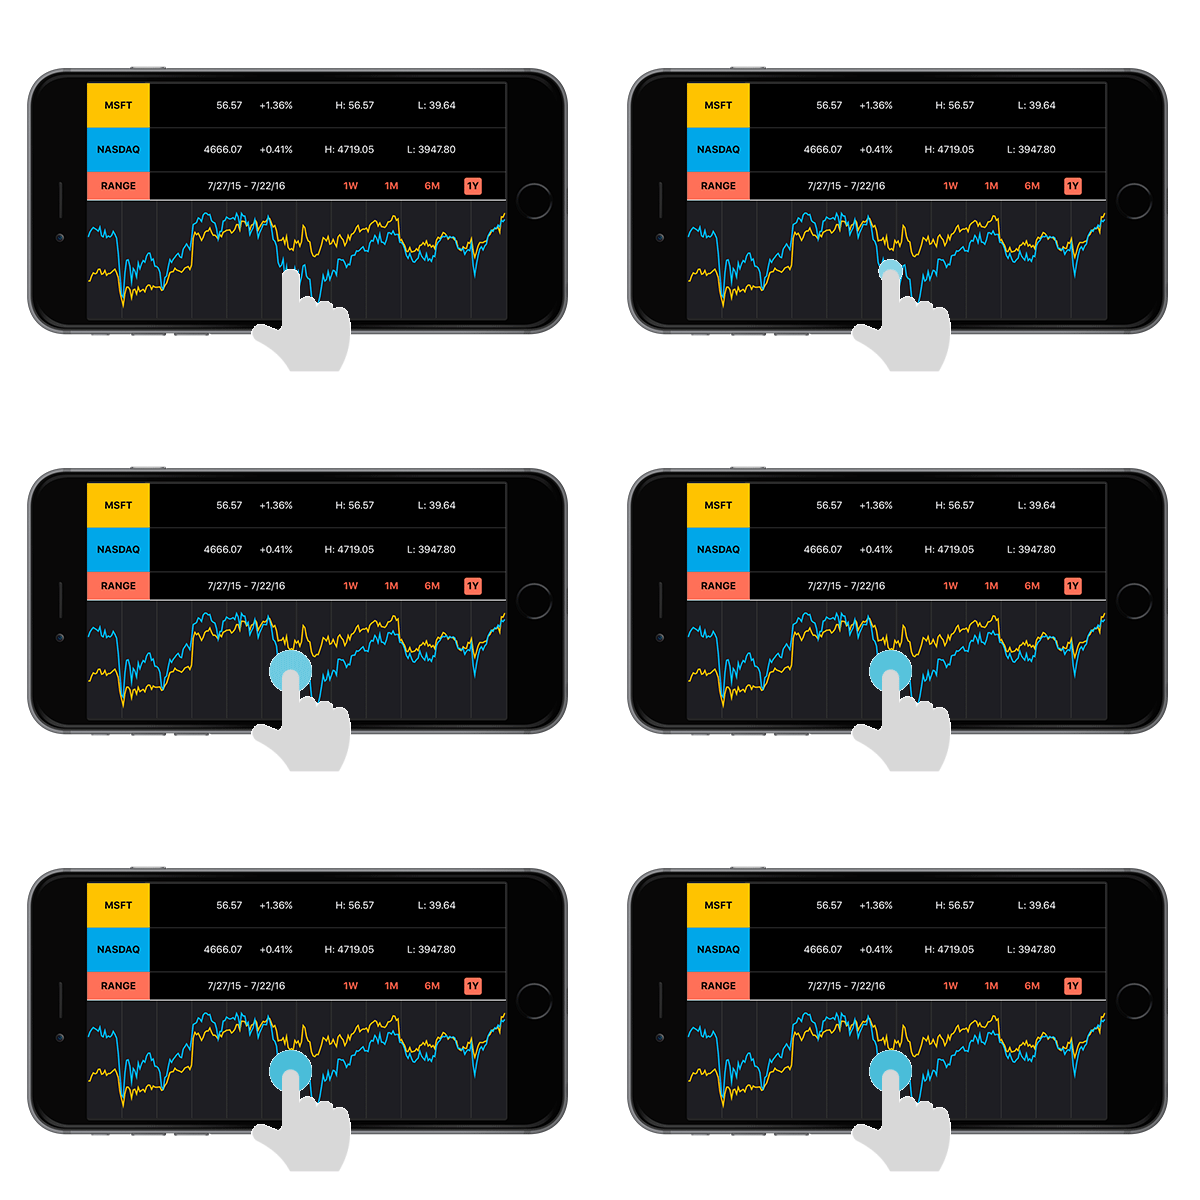
Open the app and drag a finger left and right across the bottom half of the phone screen to play a sonified line. The horizontal movement traverses X-values (dates), and corresponding Y-values (stock prices) are represented through rising and falling pitch.
Tap anywhere on the graph to hear the X and Y values at that point.


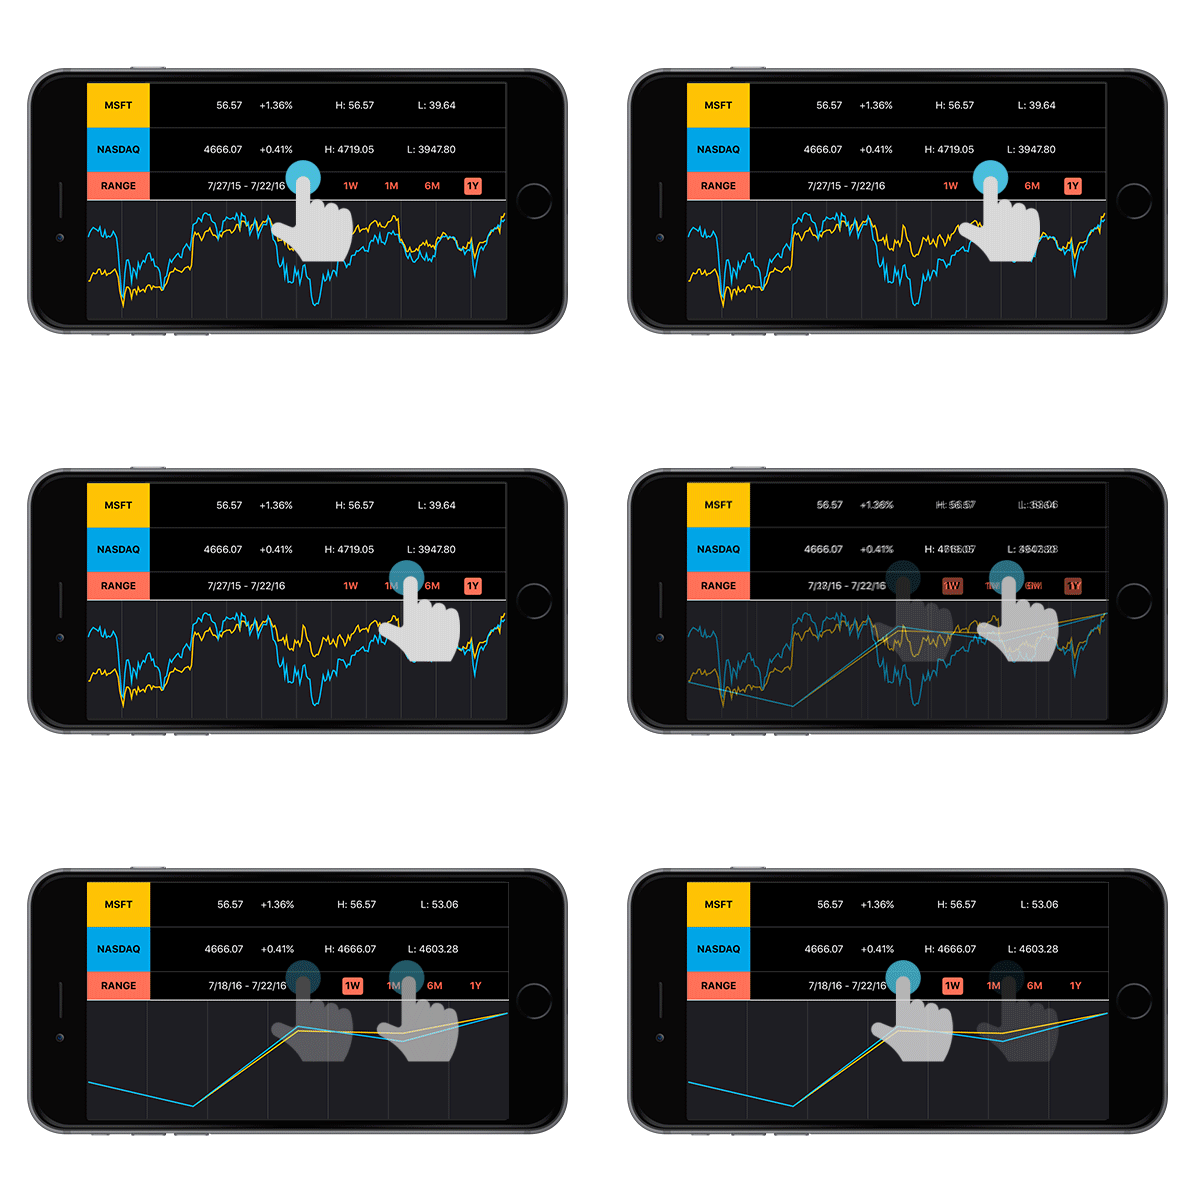
Interact with the top half of the screen to navigate a menu that is compatible with VoiceOver, Apple's in-built screen reader. Use VoiceOver gestures to navigate the menu to access summary information about the graph, including current price, highs and lows, and date range.
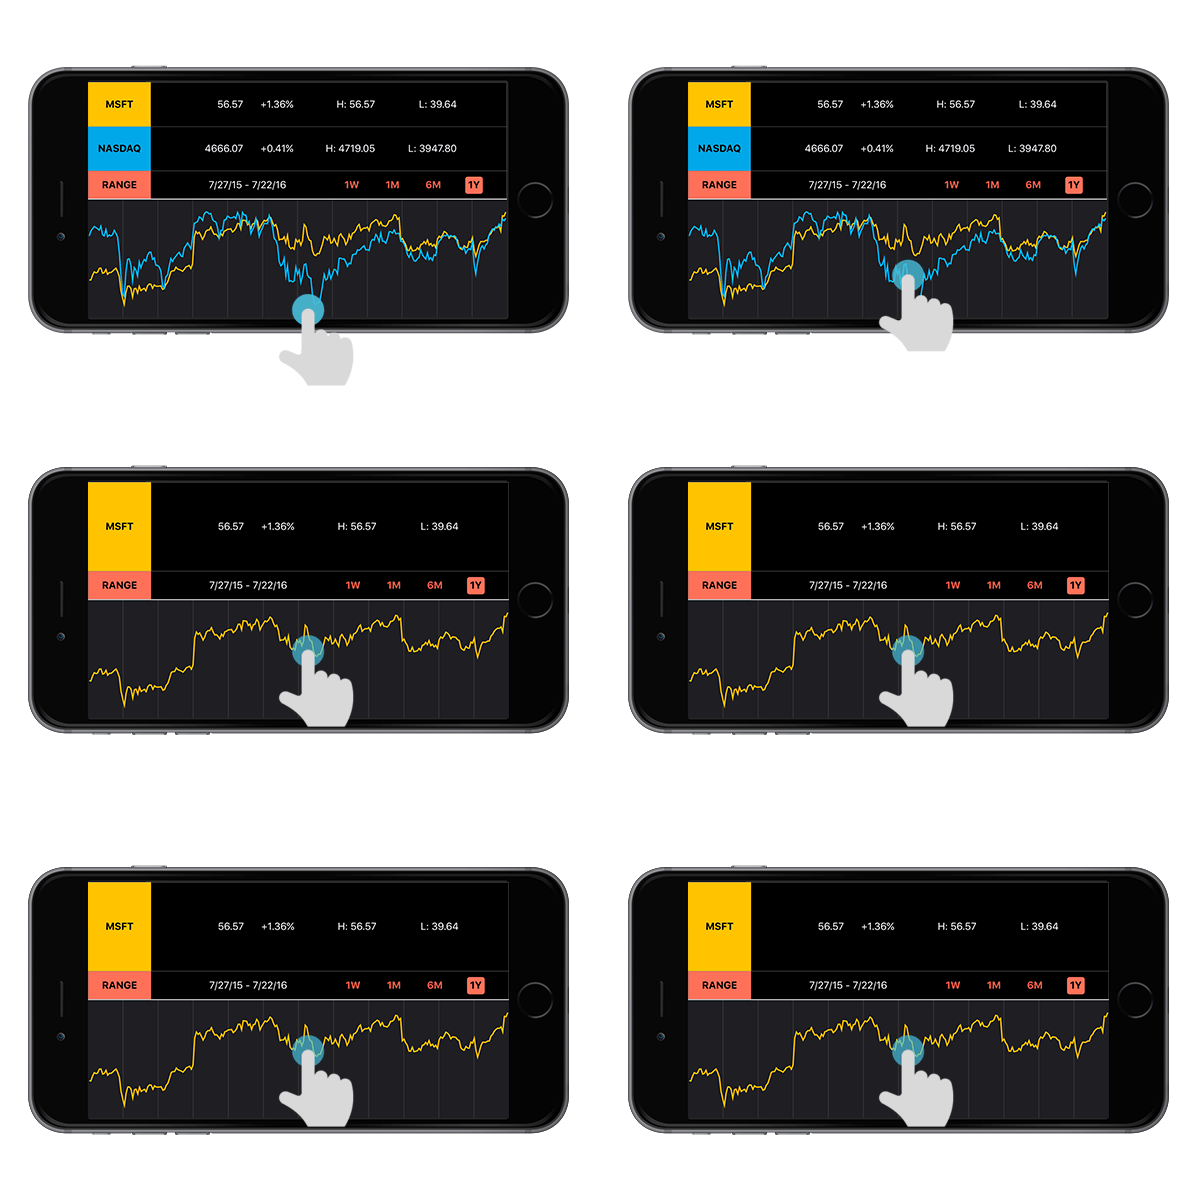
Swipe down in the graph section to switch to a second line. Swipe down again to access both lines simultaneously. Each line is represented by a different sound, to distinguish between the two for comparison.

We chose to include a visual representation of each graph in Sonify for a couple of reasons. We wanted people with partial visual impairment to be able to read graphs as they typically do, with our technology supplementing or enhancing their experience. We wanted our users to be able to communicate about graphs with people who are sighted. With our app, both sighted and non-sighted users can collaborate to navigate and interpret a line graph.