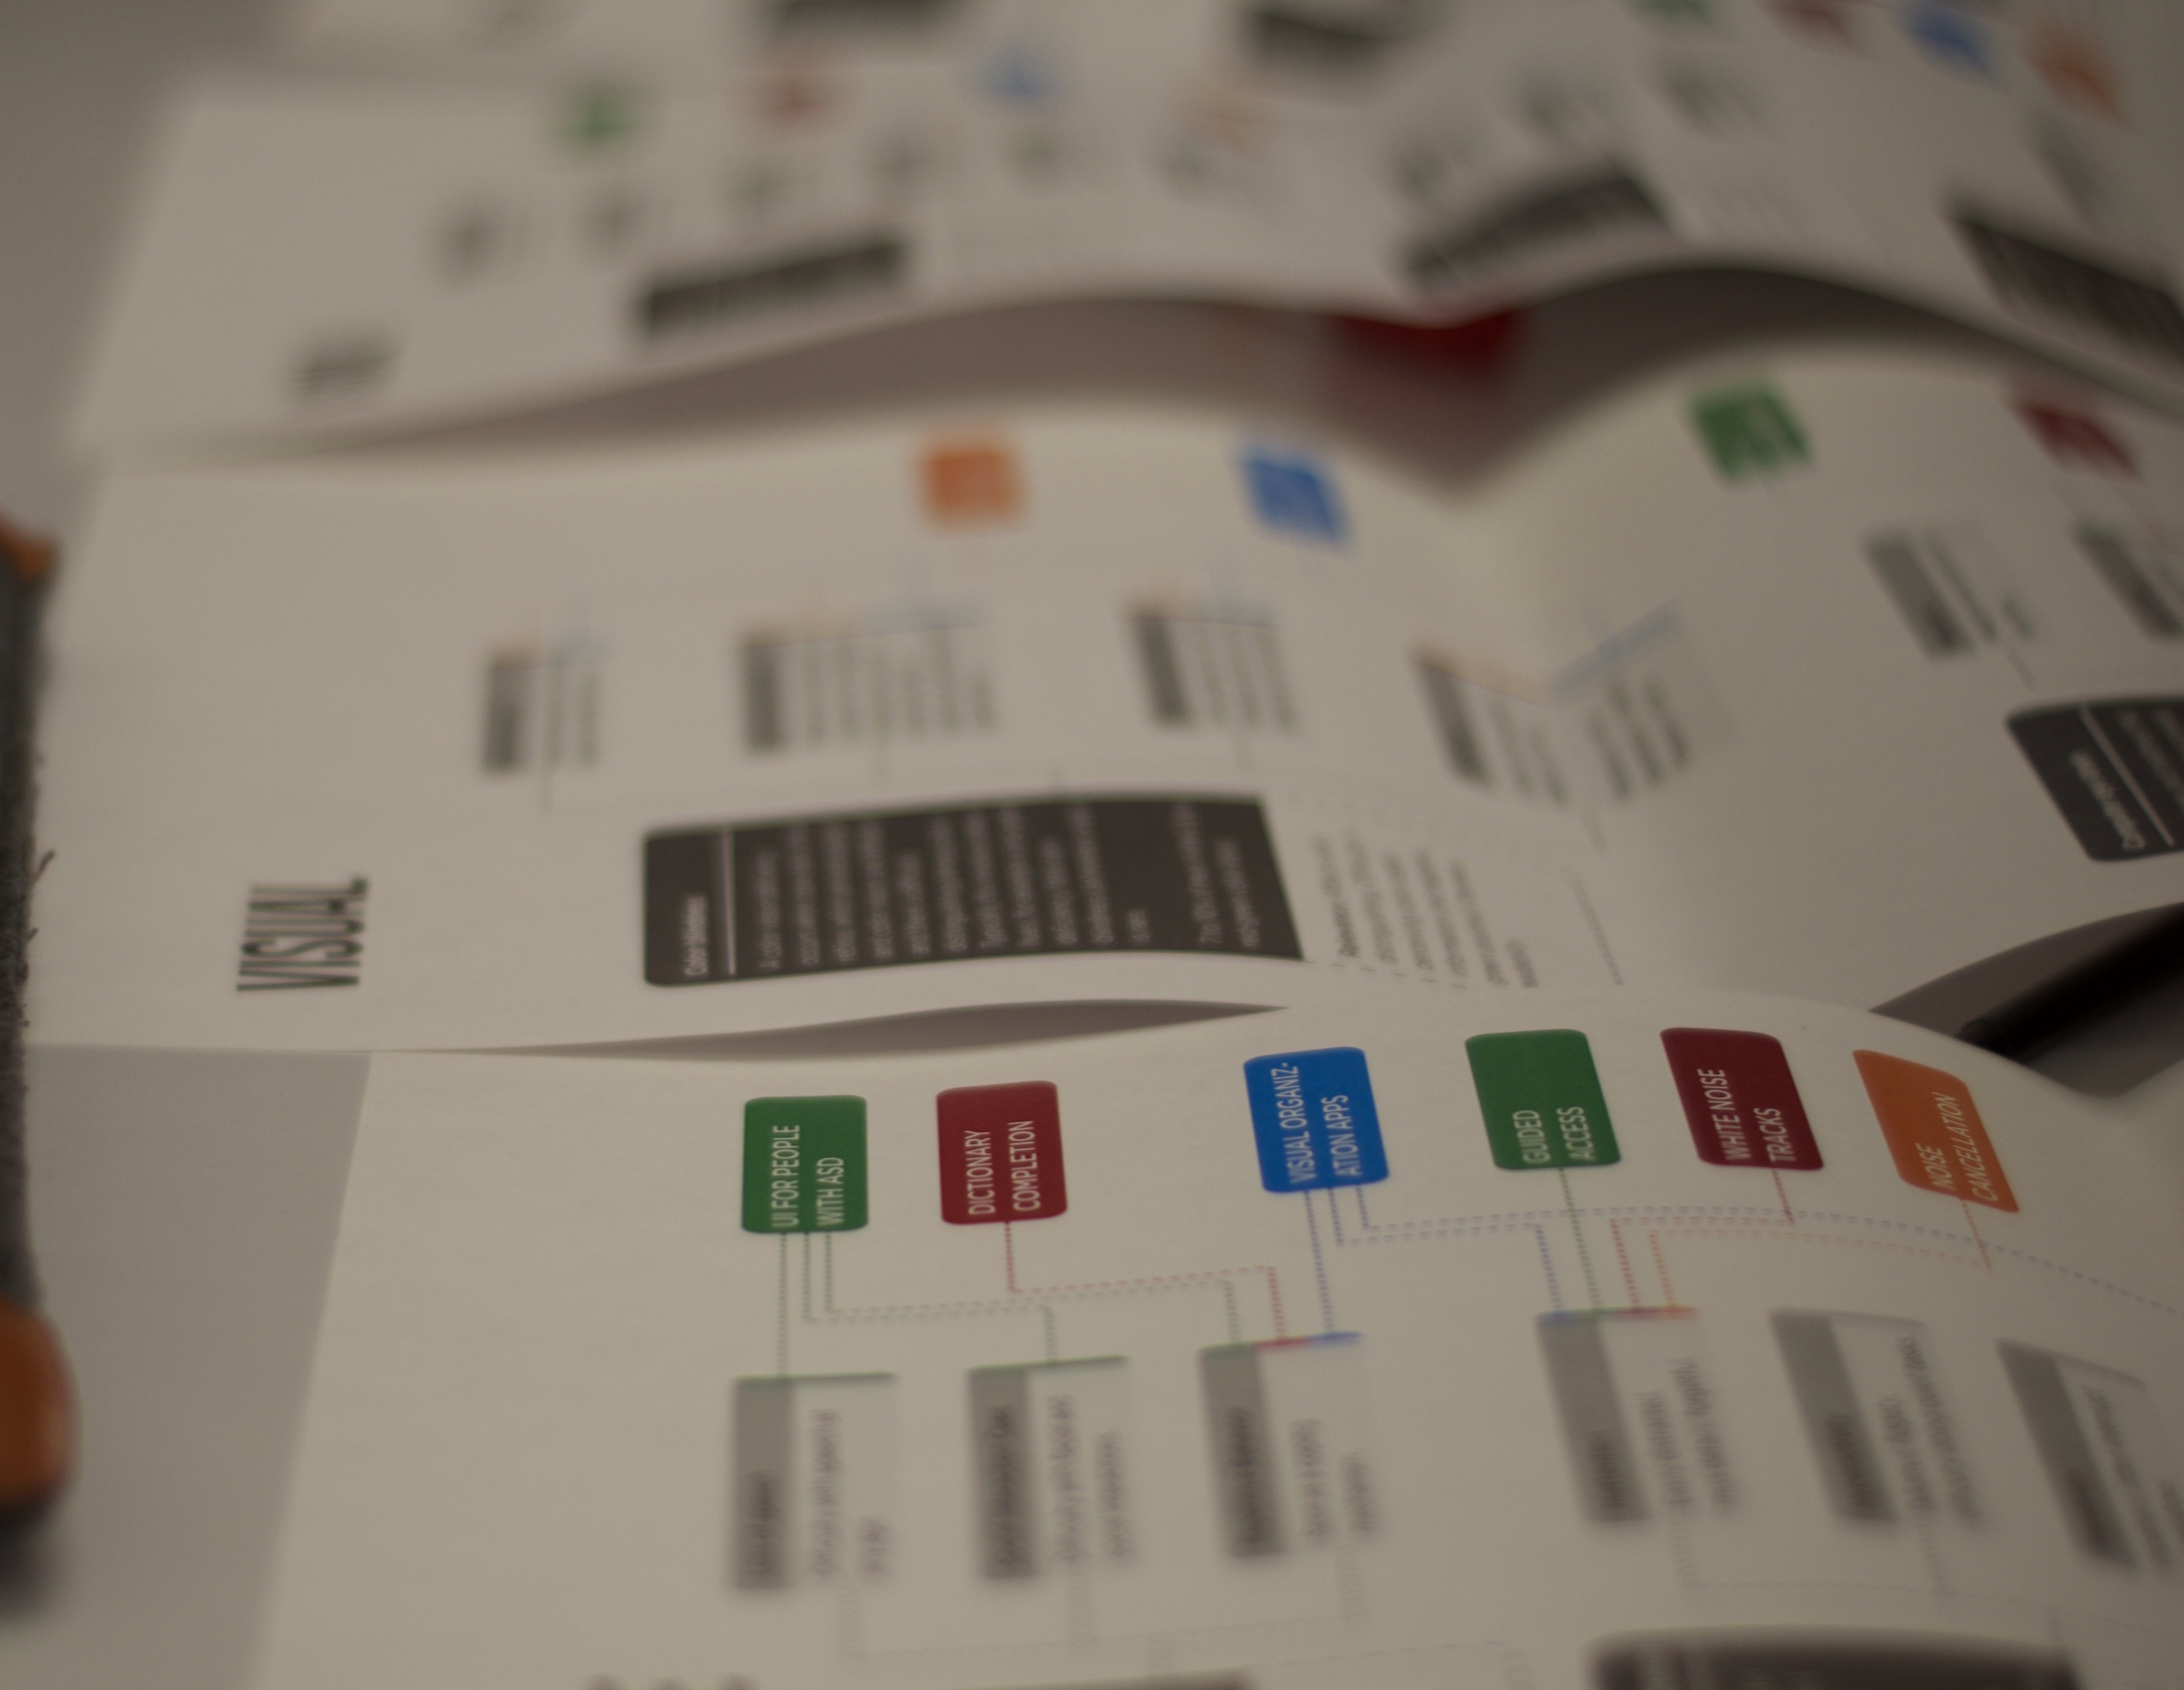
We are a team of Master's students studying Human-Computer Interaction at Carnegie Mellon University (CMU). We partnered with Bloomberg L.P. to research the accessibility of desktop applications, including the Bloomberg Terminal. We began by conducting a literature review of accessibility-related conditions and limitations, their effect on computer use, and their existing technological solutions. The map on this page demonstrates that limitations (ex: blurry vision) are more relevant to computer accessibility solutions than their associated conditions (ex: Albinism). From this map we also see that a single accessibility tool can serve multiple conditions. For example, screen readers service both individuals with Arthritis as well as people with Glaucoma. Finally, we found that there are many more solutions for visual and motor impairments than for auditory and cognitive impairments.
To understand the accessibility needs of desktop users better, we interviewed computer users with disabilities and completed empathy-building exercises and computer simulations. After considering unmet user needs, relevance to Bloomberg, and team interest, we decided to focus on designing a solution for the following research insight: It's impossible to get the gist of a page.
Our design process was iterative. We went through several rounds of expert reviews, scoping down to more concrete ideas, building prototypes and testing them with users. We took what we learned from each round of testing and applied it to improve the next iteration of our prototype.
Our final product is a culmination of our design work. The features of the graph are derived from actual tasks that financial executives perform and have been refined based on feedback we received from actual users.
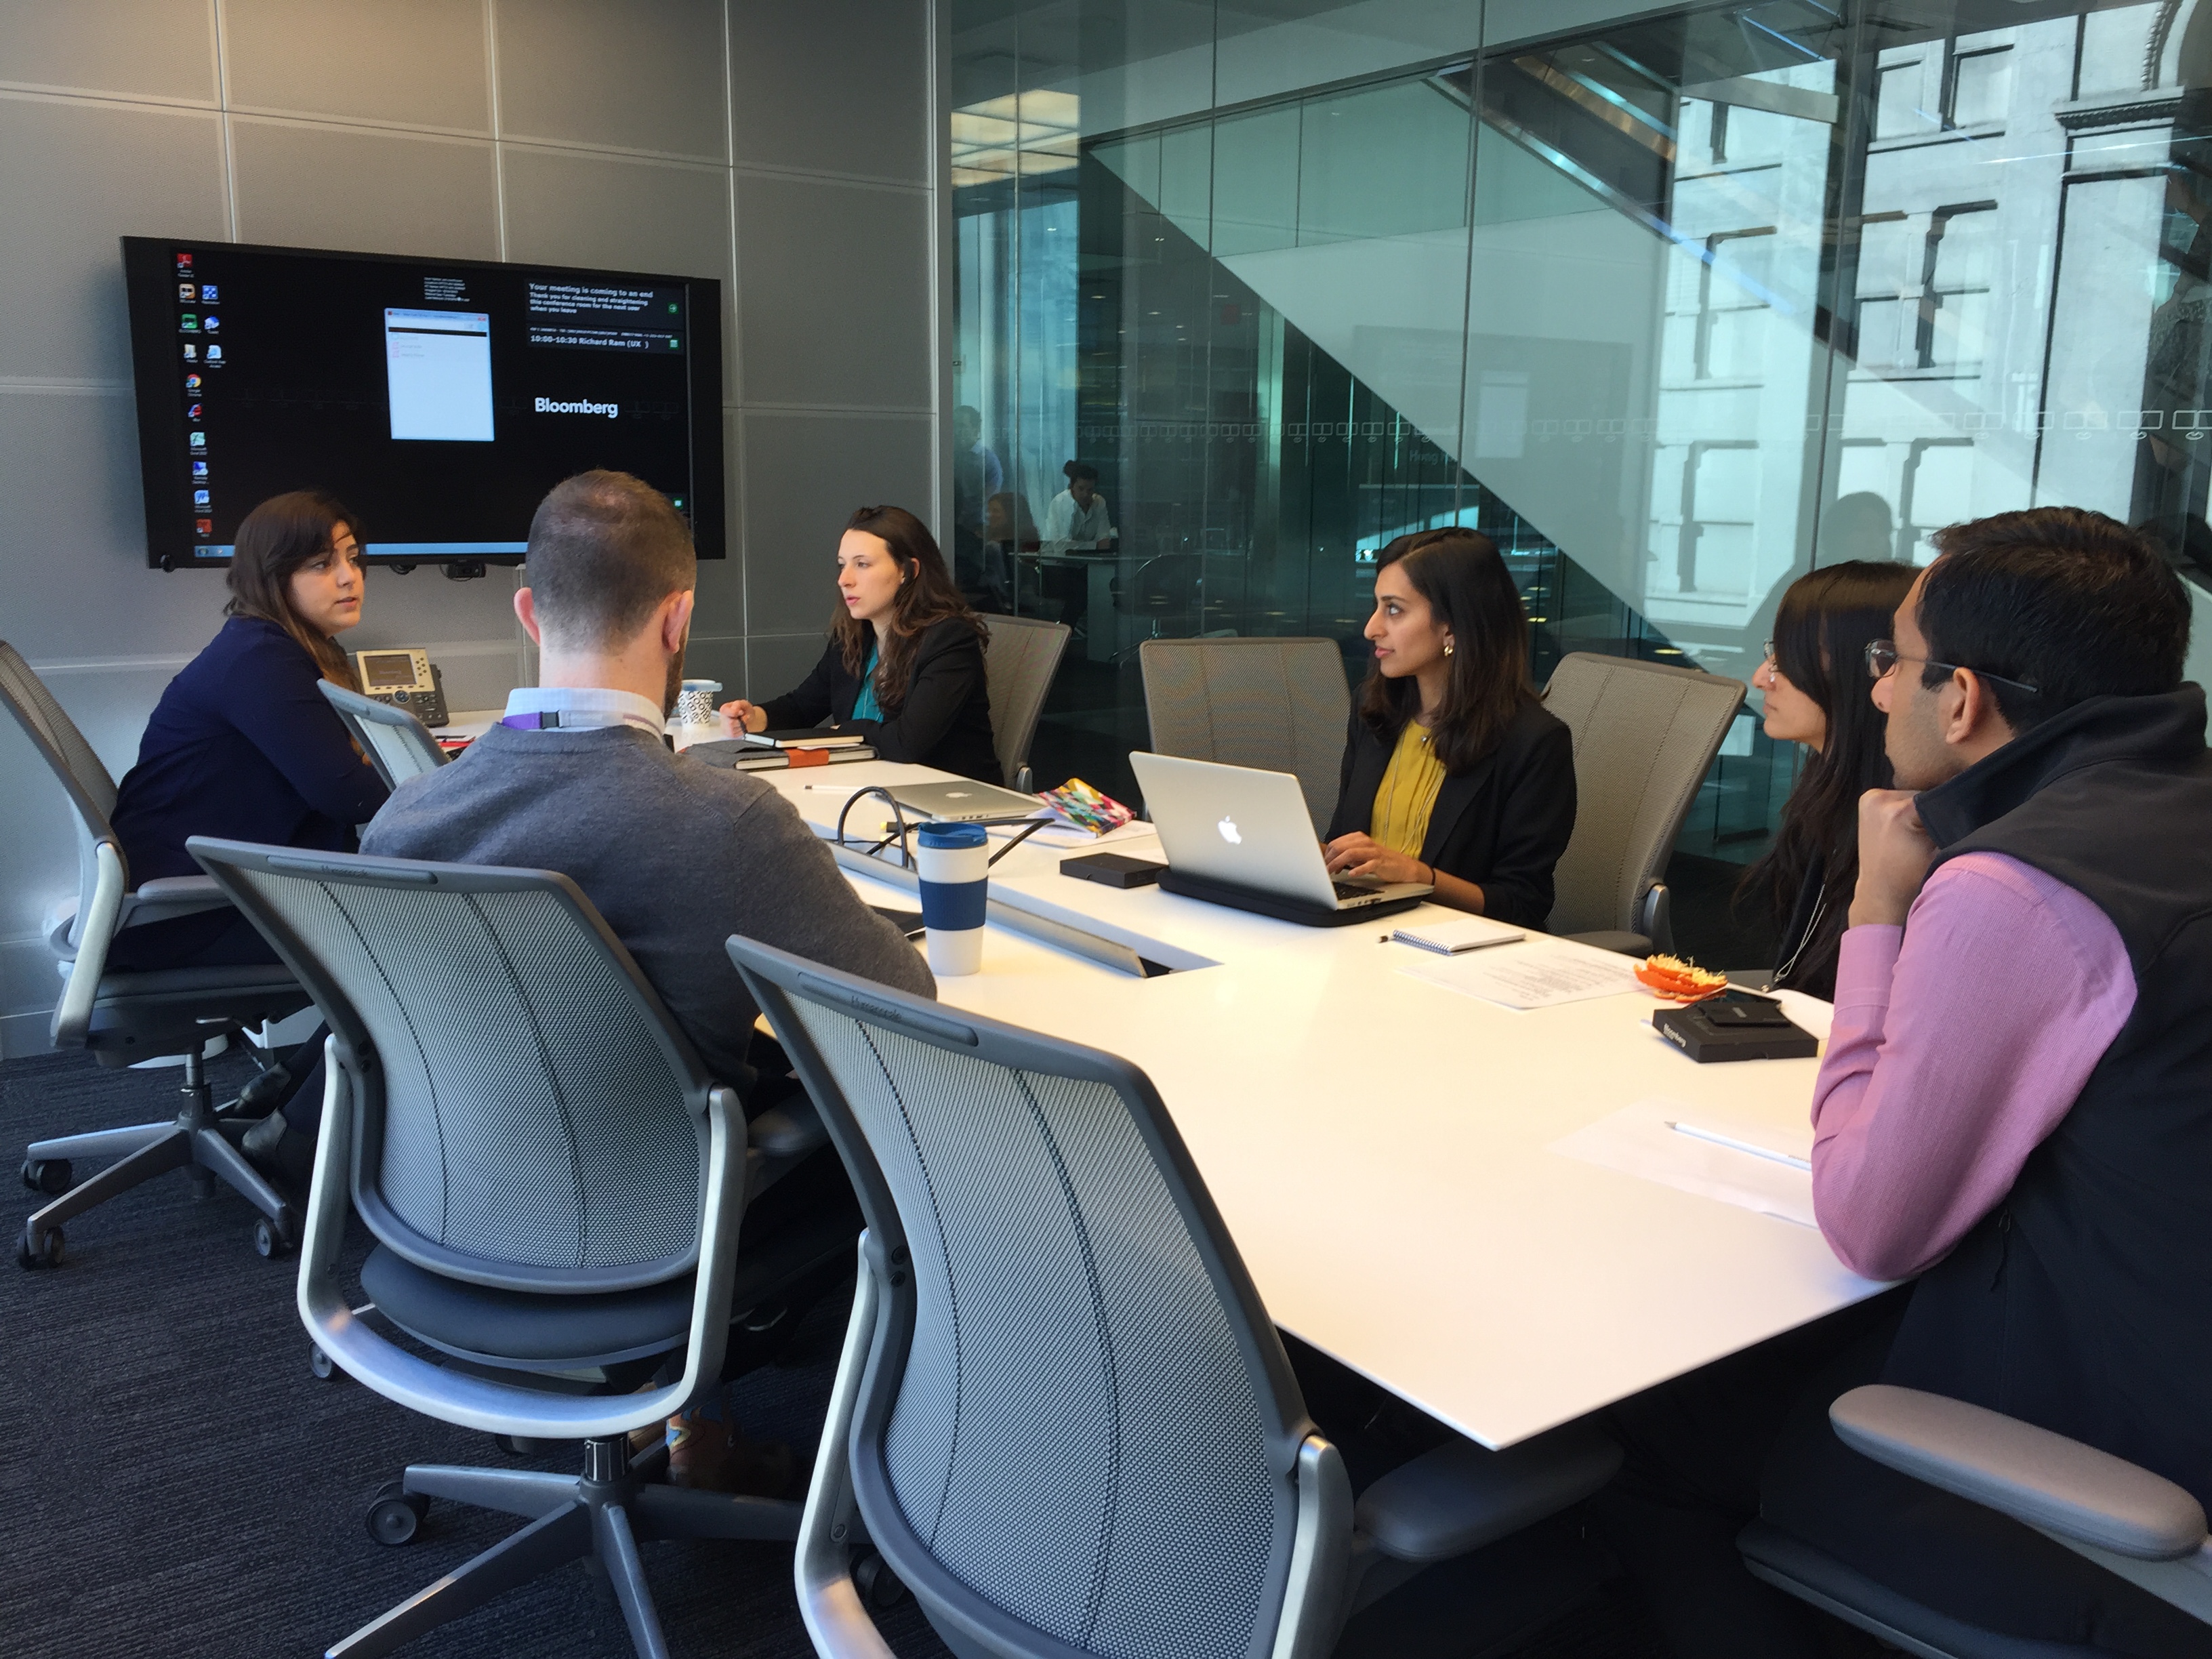
To better understand the human experience of computer accessibility, we interviewed computer users with disabilities. We asked participants to explain how their conditions or limitations affect their computer experience and any outstanding challenges they face while working.
Through observation, we could see where accessibility tools helped immensely, and where they fell short. We also noted how participants developed workarounds to overcome challenges.We conducted stakeholder interviews with various teams at Bloomberg. These interviews gave us a better understanding of Bloomberg’s internal processes and organizational structure, as well as the firm’s philosophy toward the development and use of tools to enhance computer accessibility.
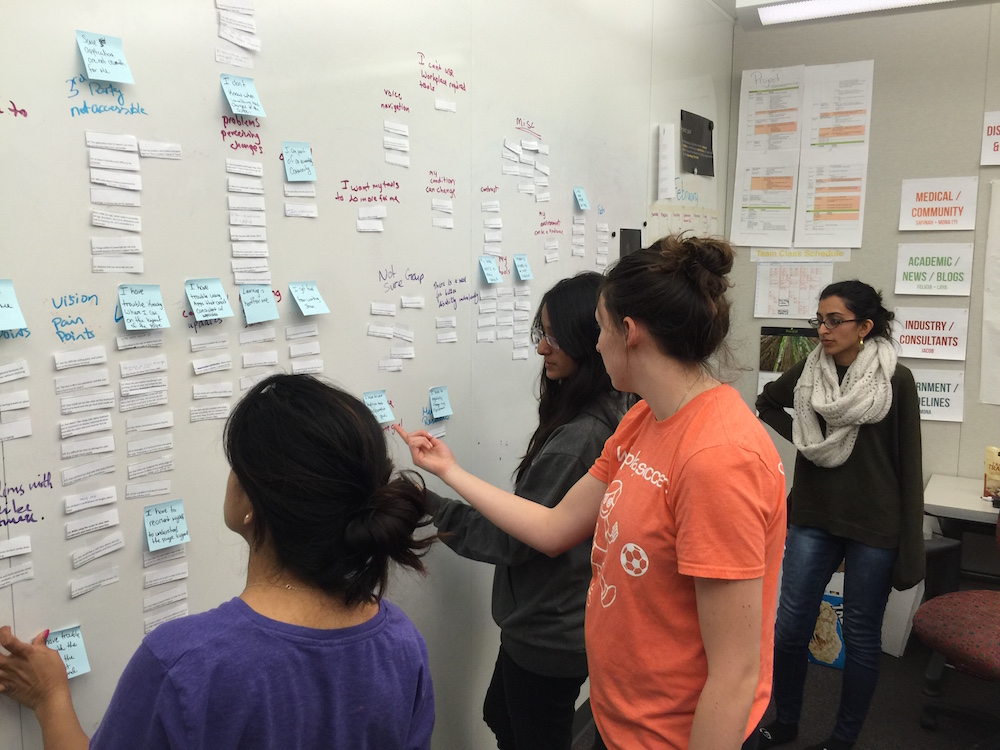
After conducting interviews and contextual inquiry, we synthesized our data into an affinity diagram. The affinity diagram highlighted how participants discovered and learned about accessibility tools as well as benefits and disadvantages of using them. It also captured participant frustrations, including the feeling that designers and developers do not care about participants, the sense that providers of accessibility software unnecessarily overcharge participants, and that people with disabilities sometimes cannot get the same experience as someone without a disability. Finally, our affinity diagram showed how participants viewed themselves in a social context, both in relation to other people with disabilities and to people without disabilities.
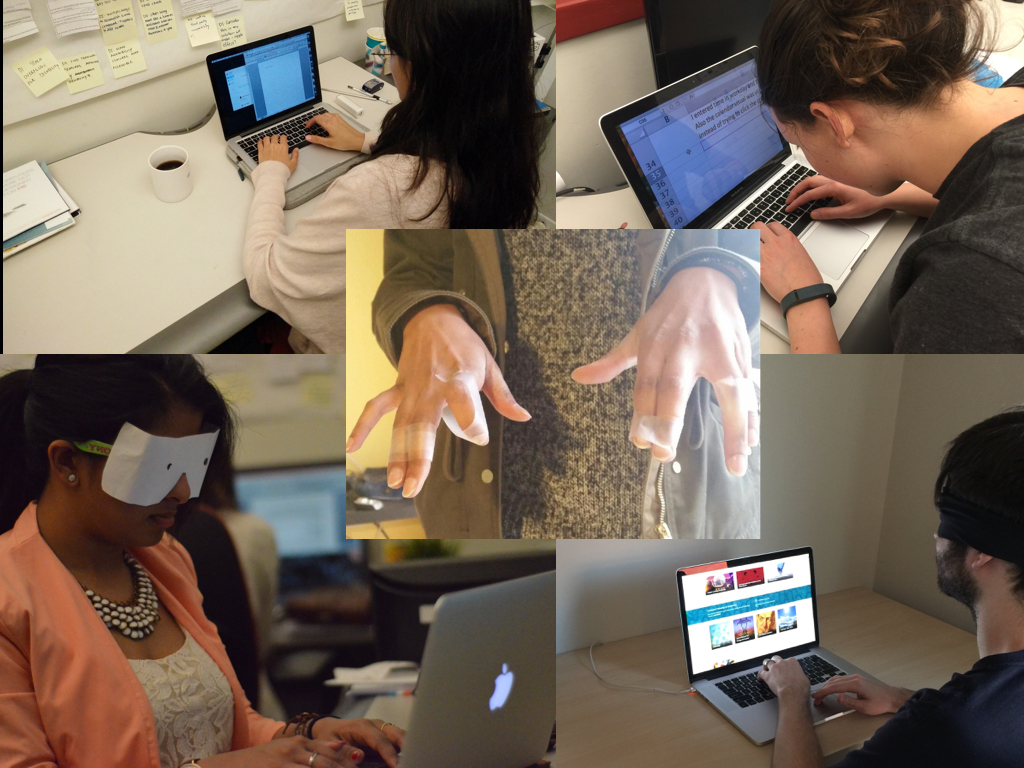
To complement our interviews and better relate to our users, we each simulated a disability and recorded our sentiments while using our computers. We simulated vision impairments (partial blindness, full blindness, tunnel vision), motor impairment (arthritis, repetitive stress injuries), and auditory impairment (deafness). These simulations helped us to better empathize with our participants because we experienced many of the same joys and frustrations that our interview participants shared with us.
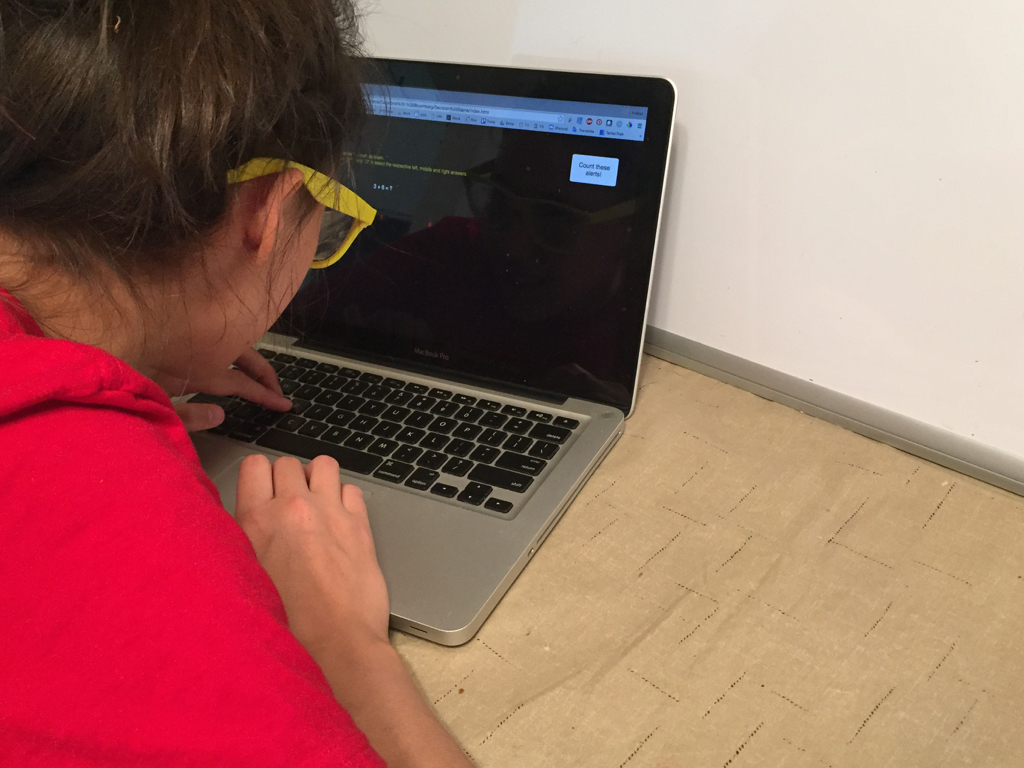
We also presented 2 subjects with a series of quick decision-making tasks which they were to complete with a simulated visual impairment. We designed the tasks to very vaguely simulate decision-making based on Bloomberg Terminal usage.
We saw that simulated disability had a strong and almost immediate effect on participant behavior; subjects became so focused on reading the content on the screen in front of them that they stopped reading peripheral content. These observations showed us that limitations can rapidly change human interaction with computers.
From our initial research we narrowed down our findings from 12 insights to 7 key insights, which are stated from a first-person perspective below: