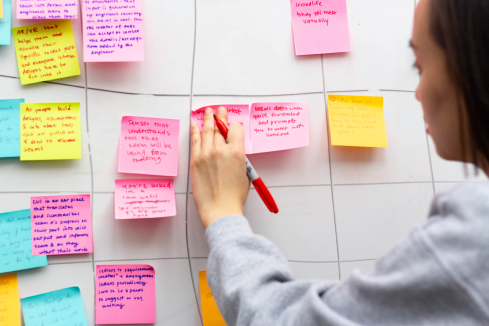
Storyboarding
We created a variety of storyboards that were used to conduct speed-dating testing to validate our user needs.
Knowledge Access
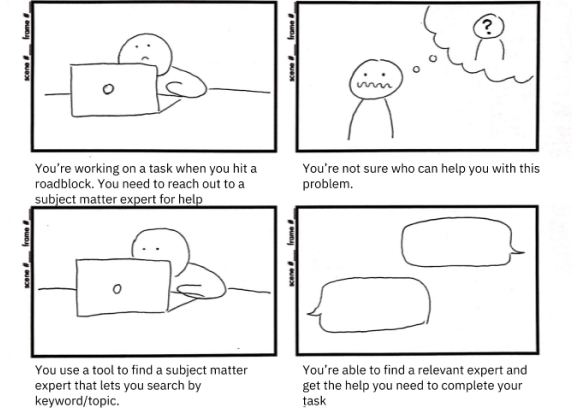
Context-aware tools
Configuration management
Prioritization alignment
Based on speed dating results, we were able to further narrow our problem scope around prioritization alignment. Participants reported this issue as being the most salient and impactful to their processes.
How can we better align different engineers’ priorities and missions? Given NASA’s large and complex organizational structure, challenges exist around syncing different teams together.
Creative Matrix
To encourage further divergent thinking, we conducted a creative matrix ideation exercise. This exercise gave us dozens of new concept possibilities, but helped us hone in on the most interesting design opportunities.
Proactively align assumptions
When teams operate on different assumptions without communicating, incompatible designs are discovered and lead to rework.
Enhance data consolidation
Data is spread across platforms and systems and makes it difficult to communicate the design decisions and justifications behind them.
Calibrate Priorities across different levels
When interdependent teams’ priorities are not aligned, seemingly small schedule delays can create a chain impact that cause overall larger delays.
We further scoped down our project focus by checking the above opportunities against three criteria: richness in design possibilities, scale of potential impact and actionability for implementation. Finally, we unanimously decided to move forward with a refined focus: How can we ensure design assumptions are shared across discipline teams?
Co-Design + Concept Testing
We used speed-dating to narrow our ideas down to a few key concepts that we developed into features. With lo-fi renderings of these features, we conducted concept validation sessions with both HCI designers and our stakeholder engineers to learn what features each group identified as most useful.
These 5 features we identified were:
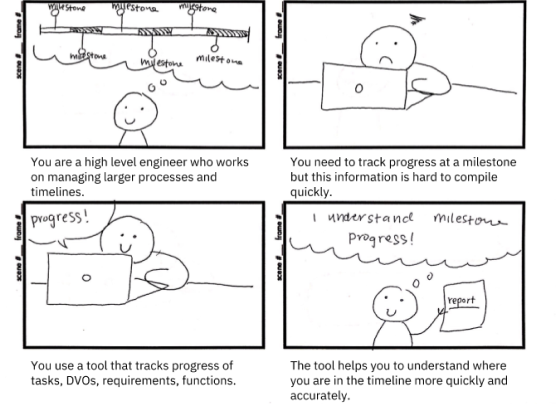
- Decision tracking improves traceability and accountability by providing historical record that may inform future decisions.
- Flagging relevant information allows engineers to call out important links between data points and helps teams shape an understanding of the interrelations between their work.
- Standards sharing compares how different teams approach designing their parts (e.g. which tools they use) to catch discrepancies and drive communication
- Document management provides visibility into other teams’ work.
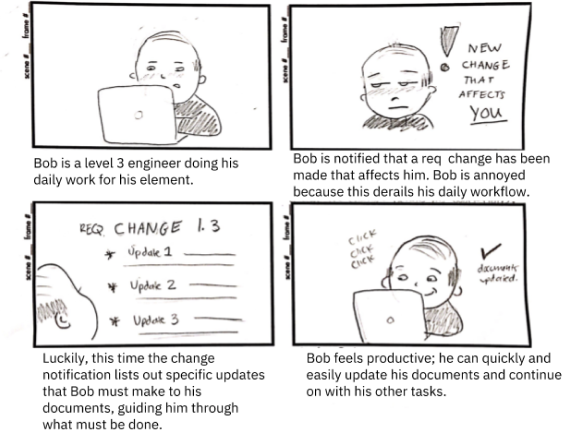
- Status update keeps everyone on the same page when there’s a change.
Rapid Prototyping + User Testing
Journey Maps + Screen Map
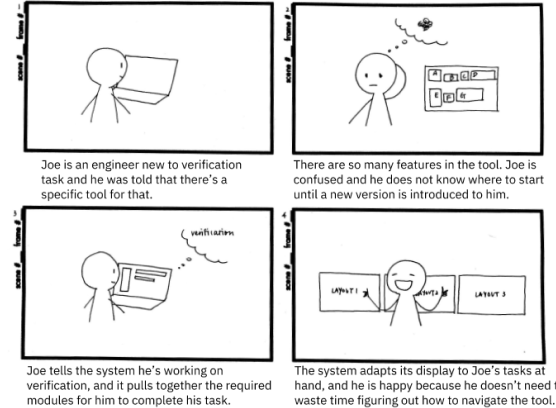
Following up with contacts made at Marshall Space Flight Center, we drilled down to a specific type of oft-misaligned design assumption to focus on: the interpretation and application of performance requirements (dictating how a rocket should operate) across different discipline teams.
We created a user journey map to represent the different stages of an engineer fulfilling a performance requirement. We focused on their intent at each step, and mapped screens that help them accomplish their goals.
Here’s an example:
When an engineer is working on their verification activities (action/step) and needs to interface with the performance requirement, they want to make sure that they’re on the same page (intent) with the teams in charge of designing the parts to be integrated with theirs, so one idea could be to create a page that surfaces such information (screen design).
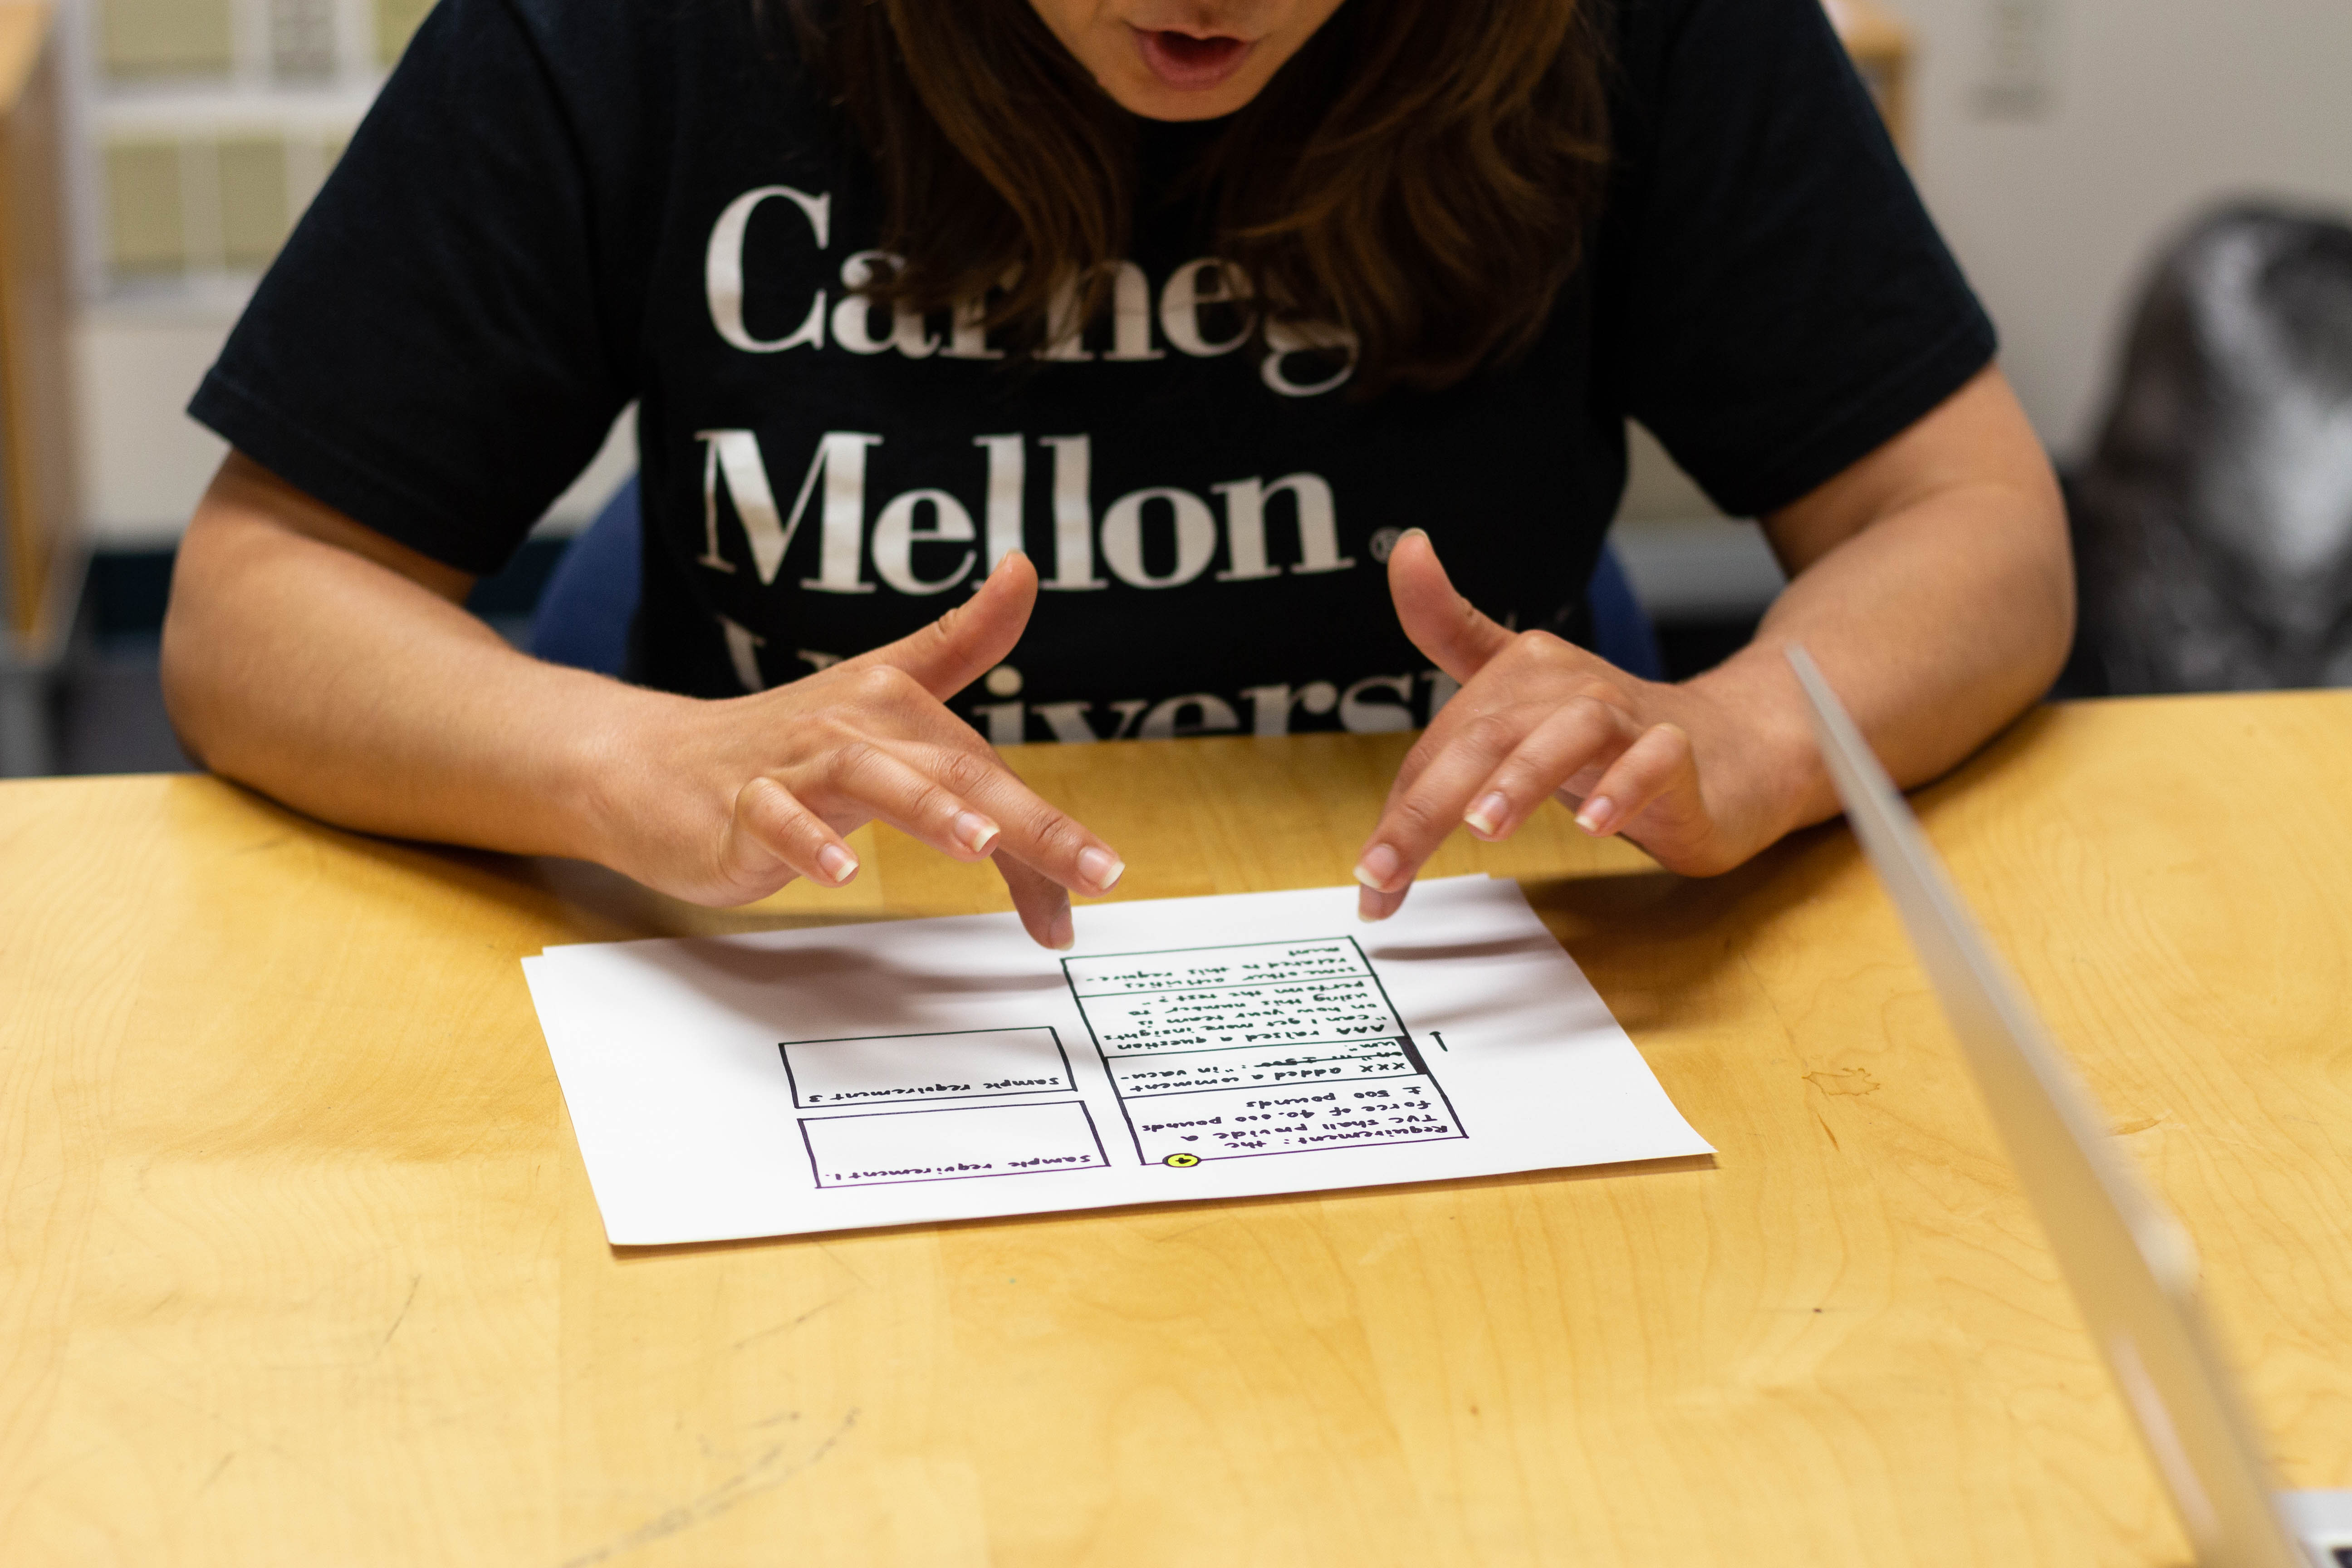
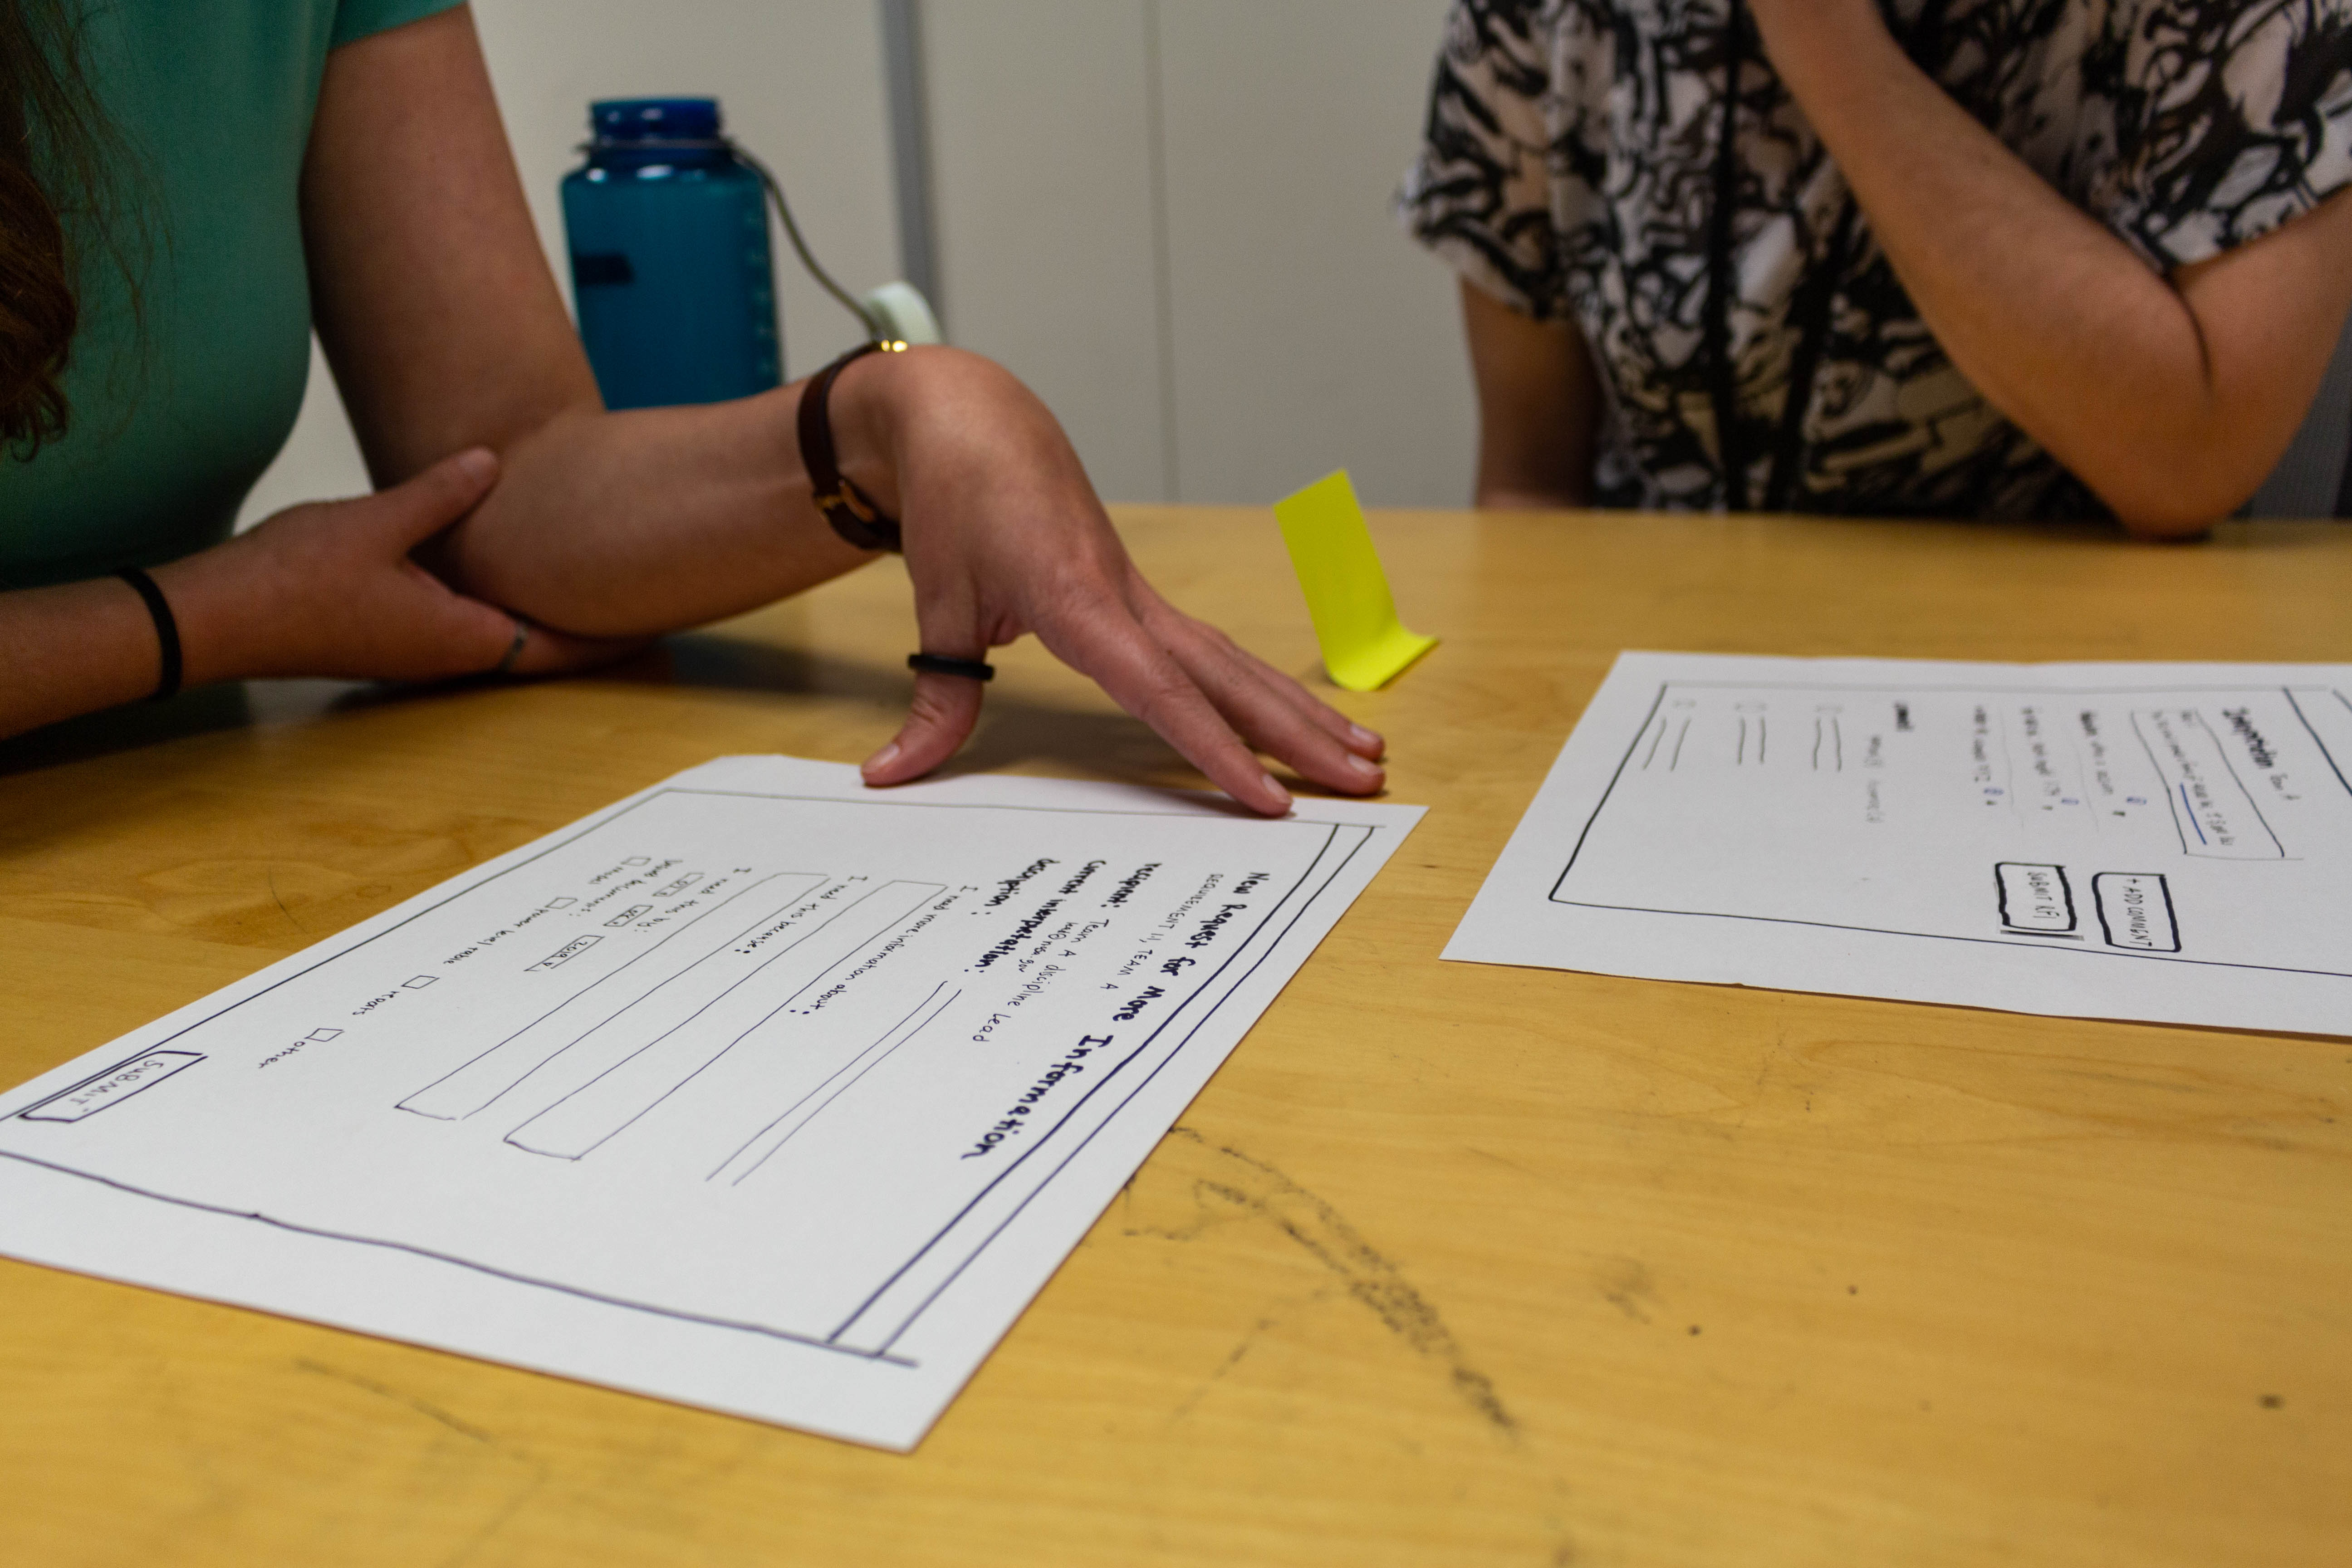
Paper Prototyping
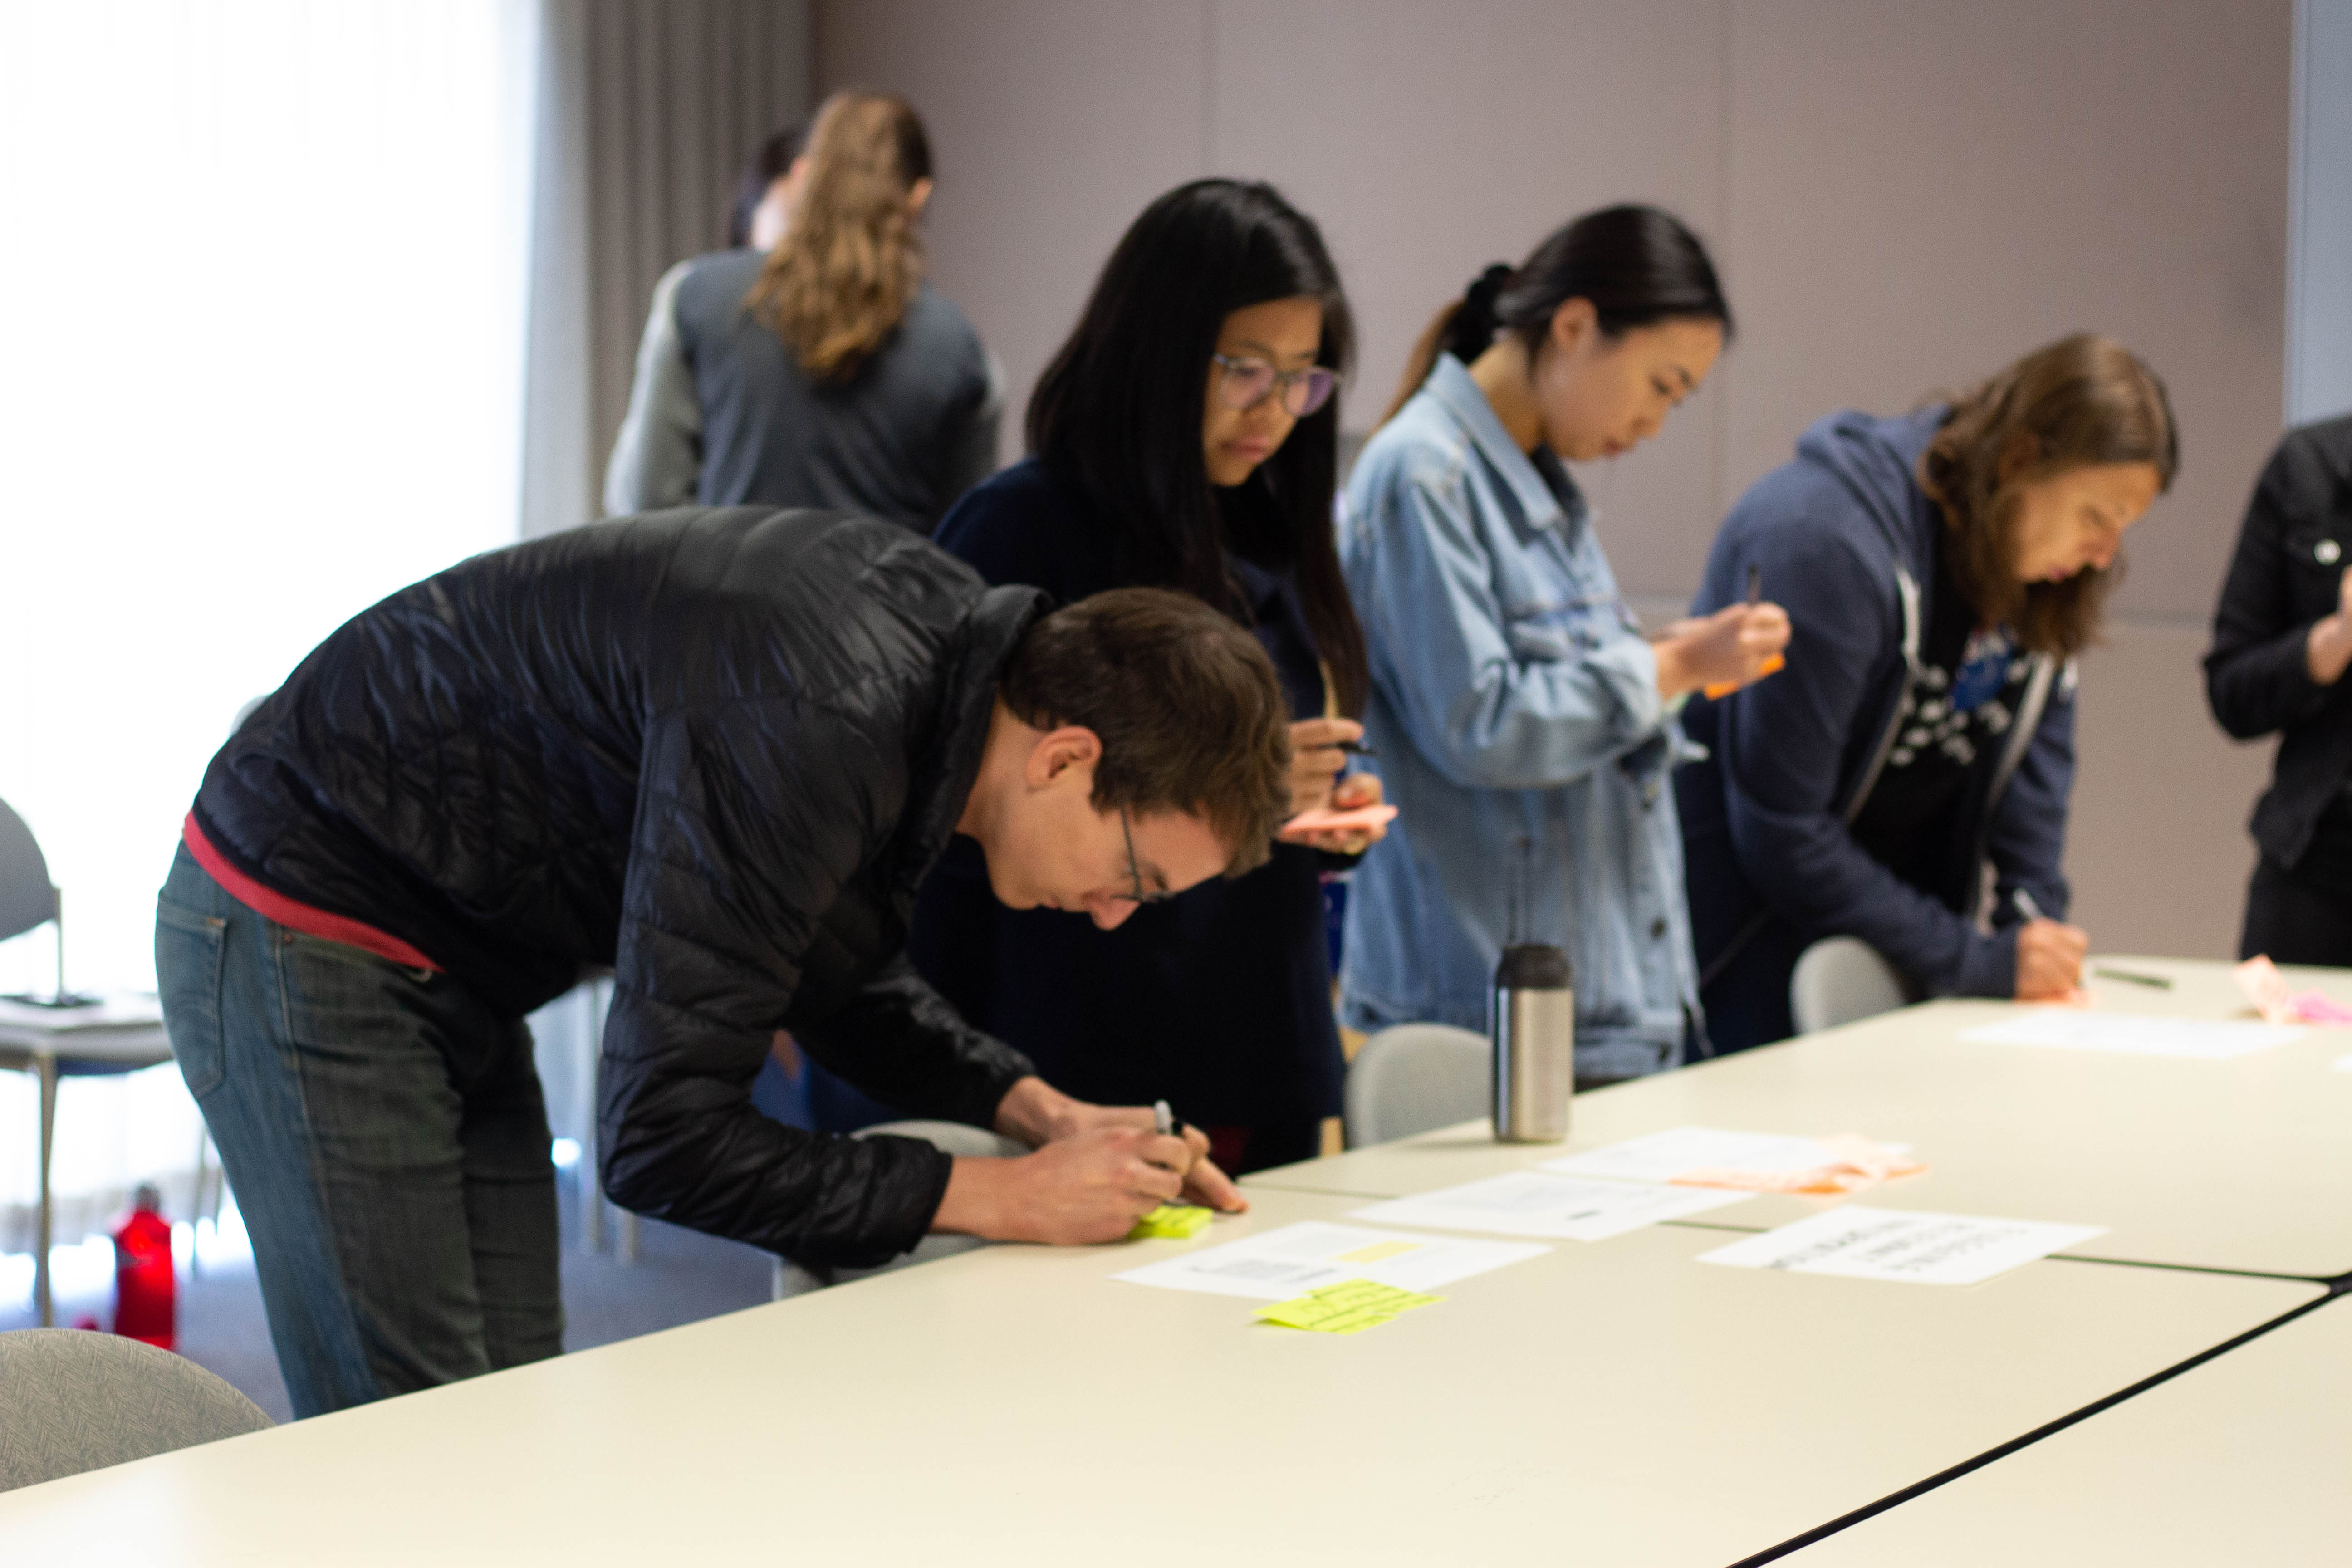
We created paper prototypes focusing on different feature types and tested them using comparison testing and think-aloud task methods. Specifically, we wanted to test whether our prototypes’ matched users’ mental models of what functionality they look for to solve problems similar to those our engineer stakeholders face.
Gathering test feedback on our paper prototypes from HCI designers based at NASA Ames was instrumental as we moved forward into defining what features and screens are essential to our eventual solution. With our new knowledge, we knew what users wanted, expected and preferred when tasked with solving alignment problems.
Mid-fi Prototyping
Once we had plotted out our users’ journey and received concept feedback from our stakeholders, we mapped our core functionalities to the screen map:
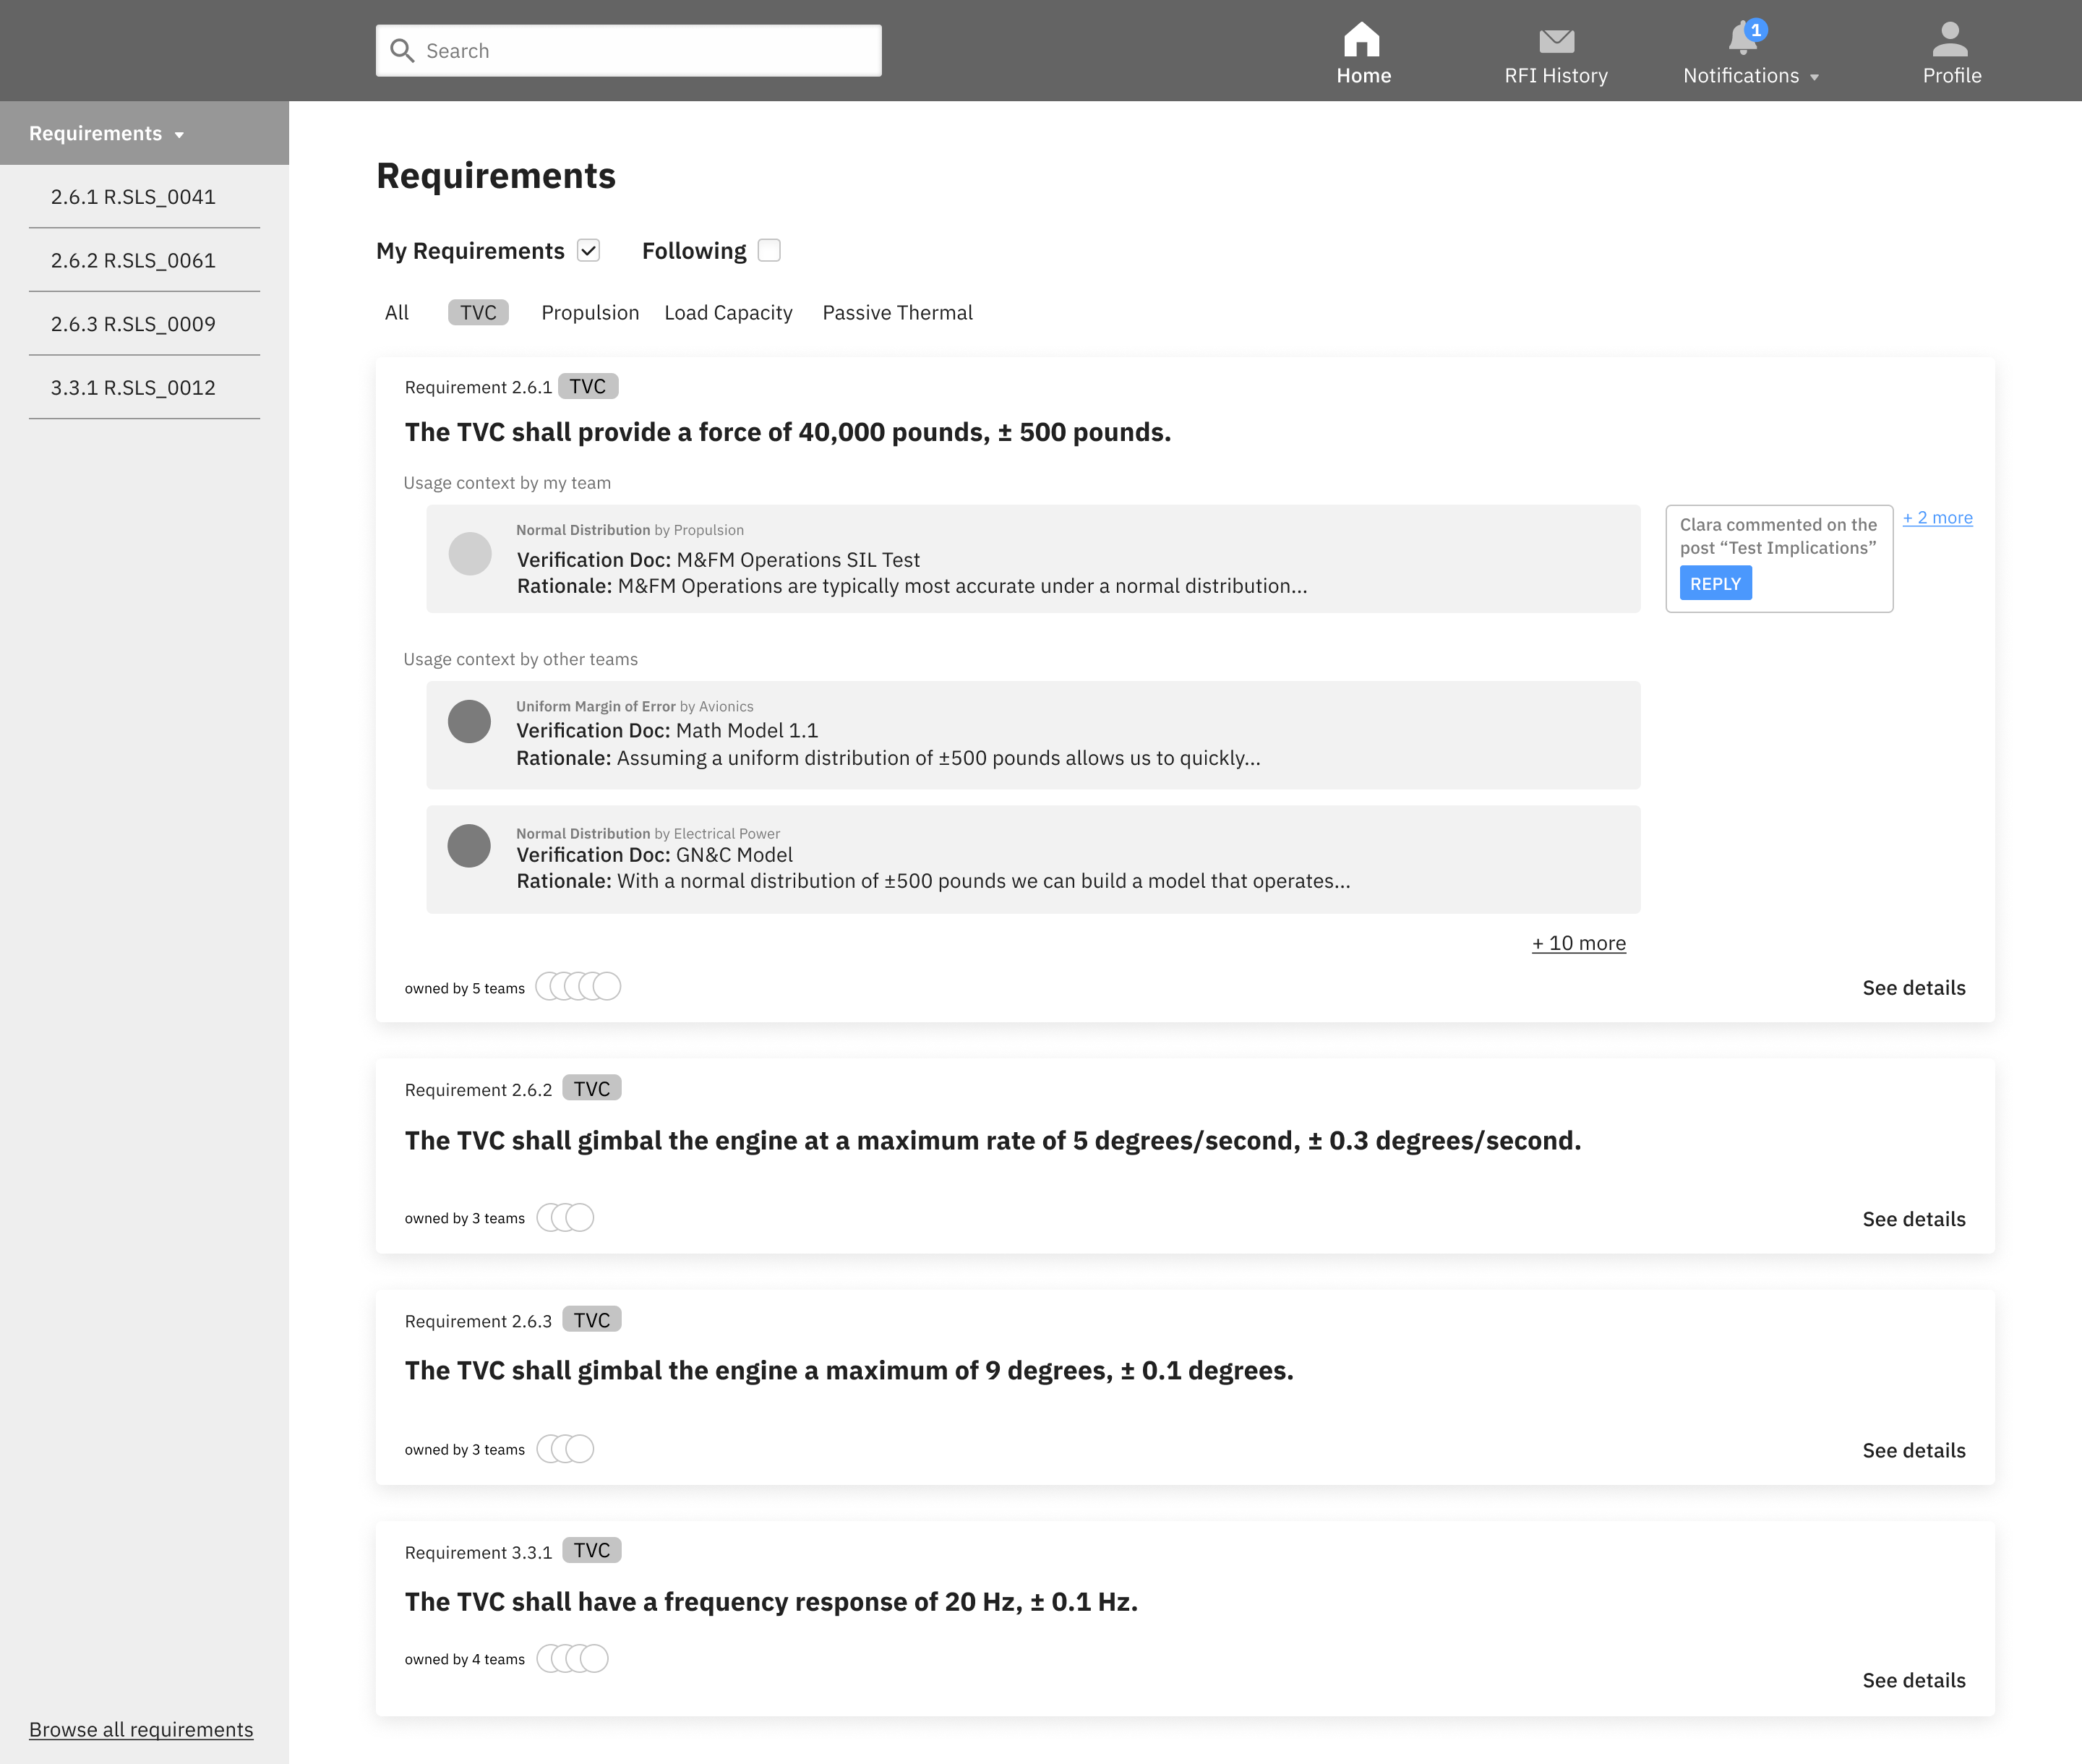
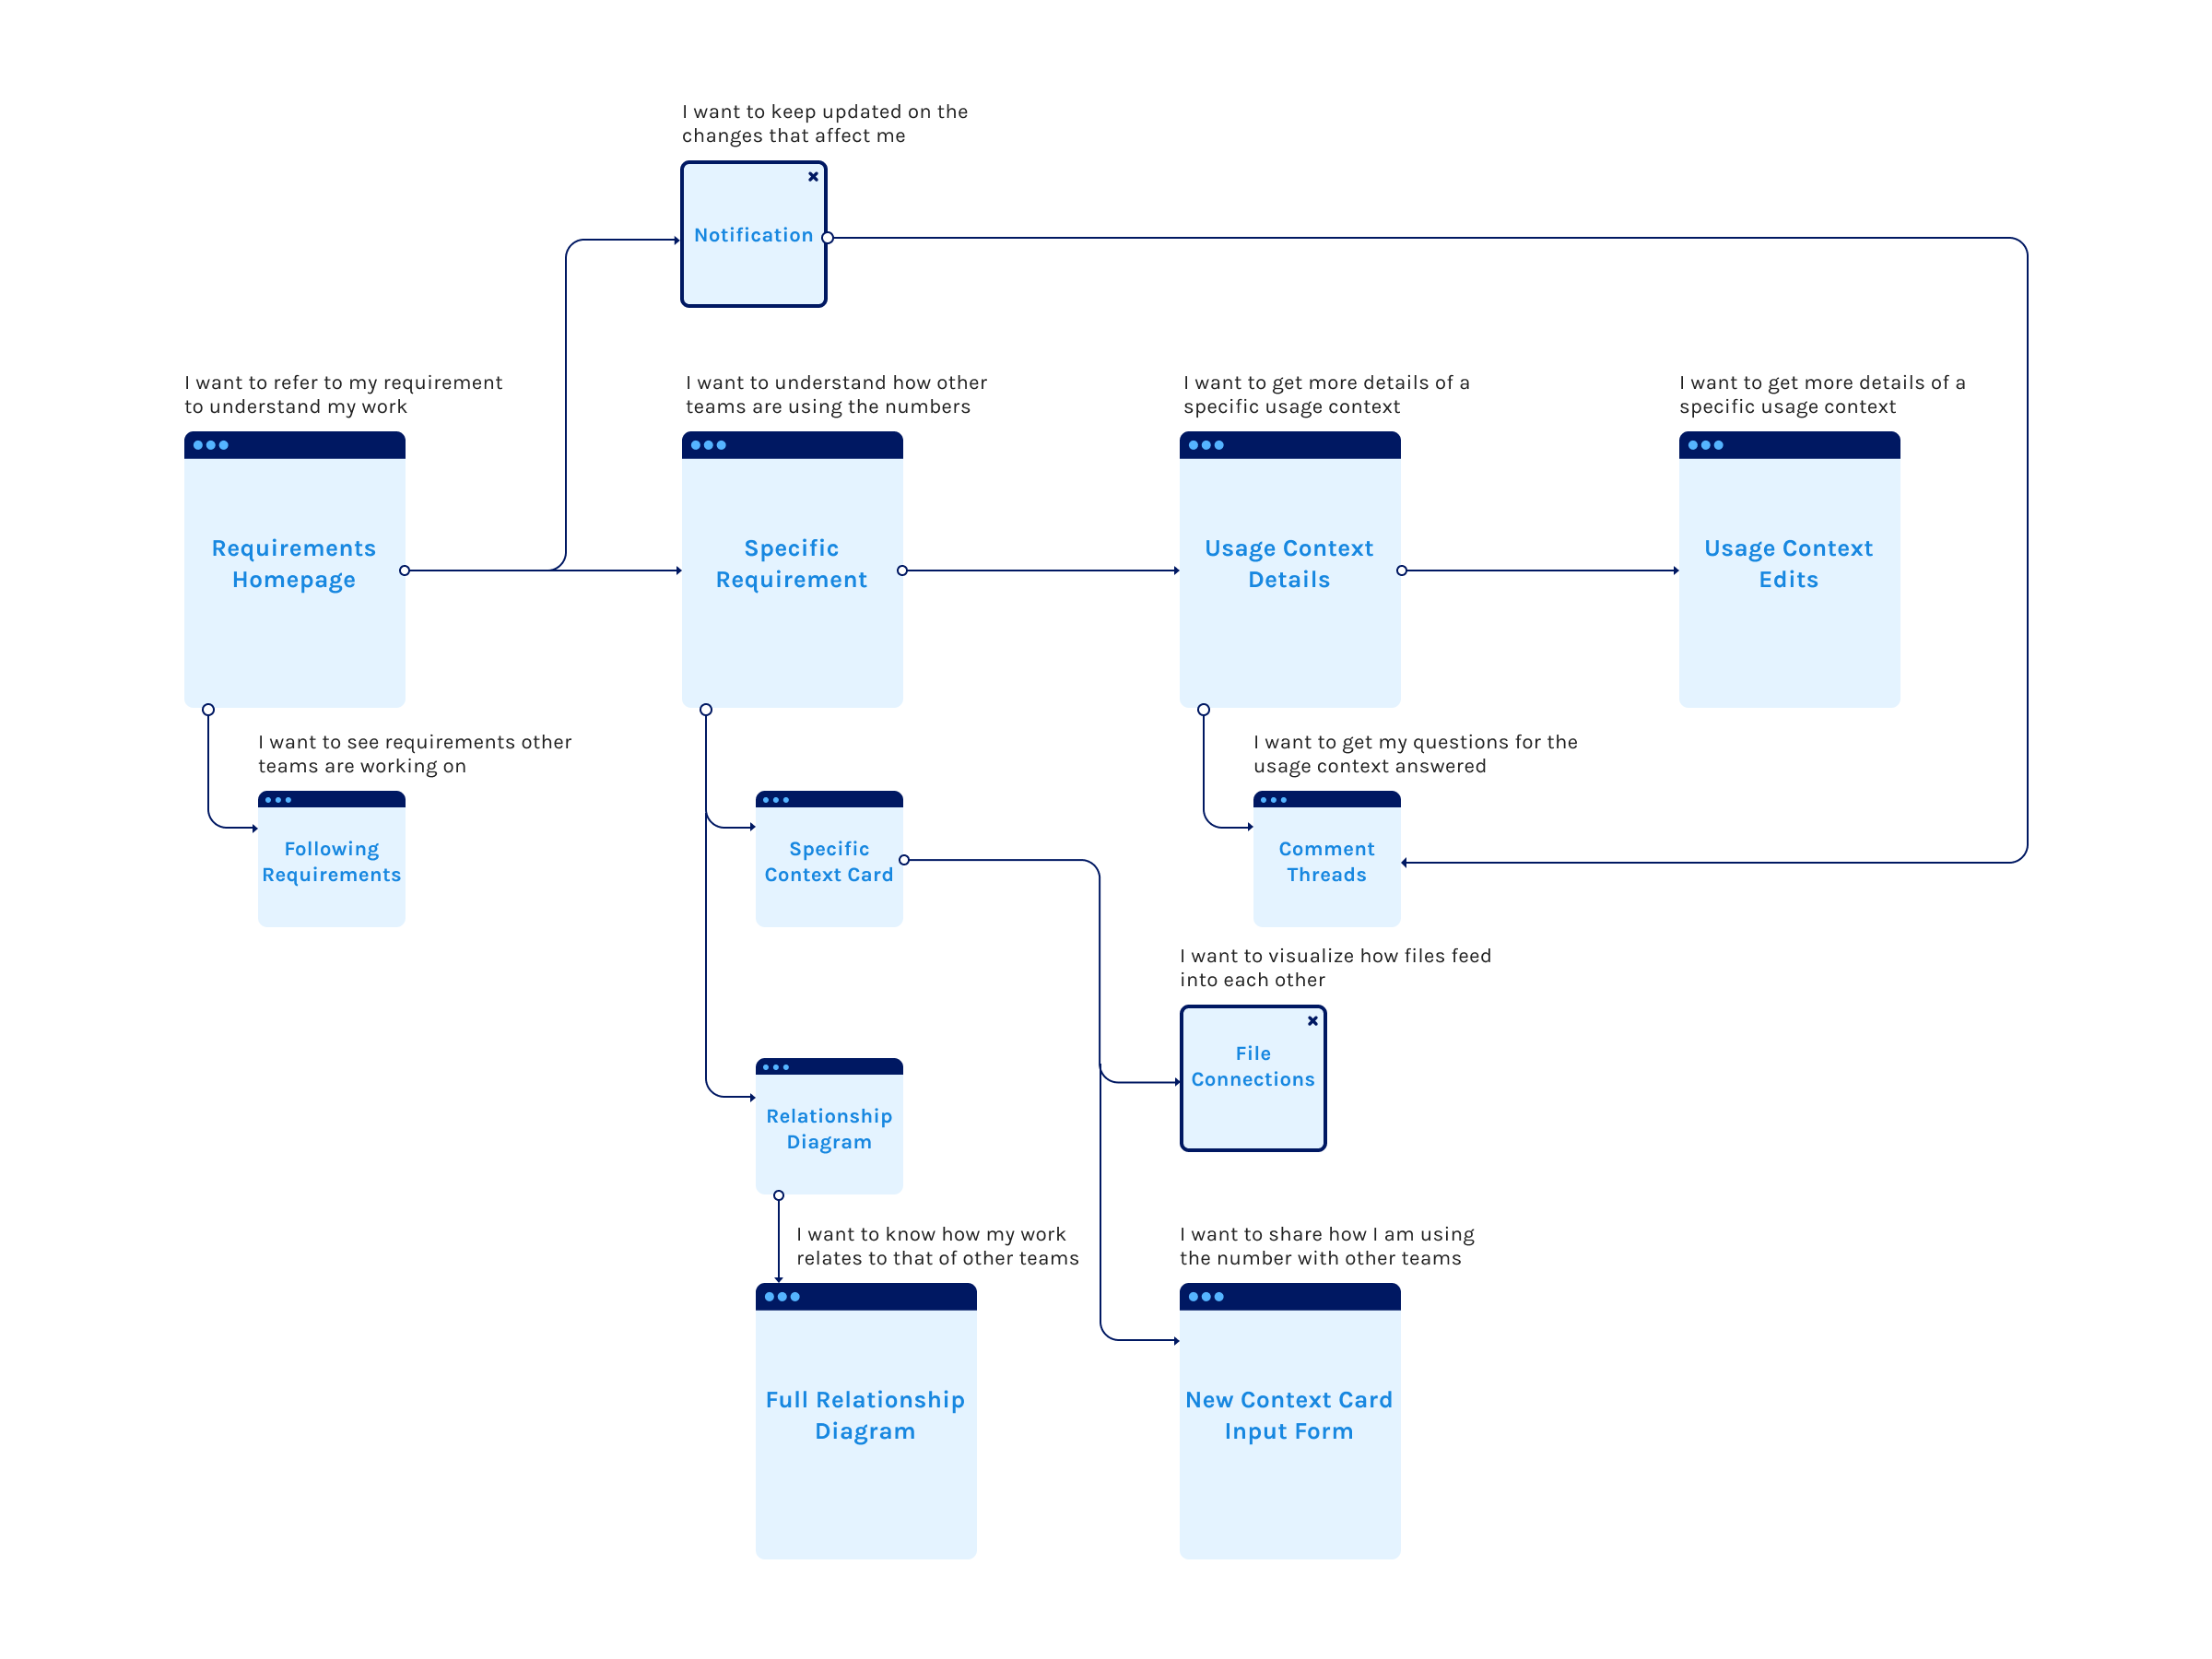
Requirements Hub
The homepage serves as a central hub for discipline engineers to access the requirements they need. The page showcases an engineer’s owned requirements and the usage contexts, verification documents, and rationale of each attached team.
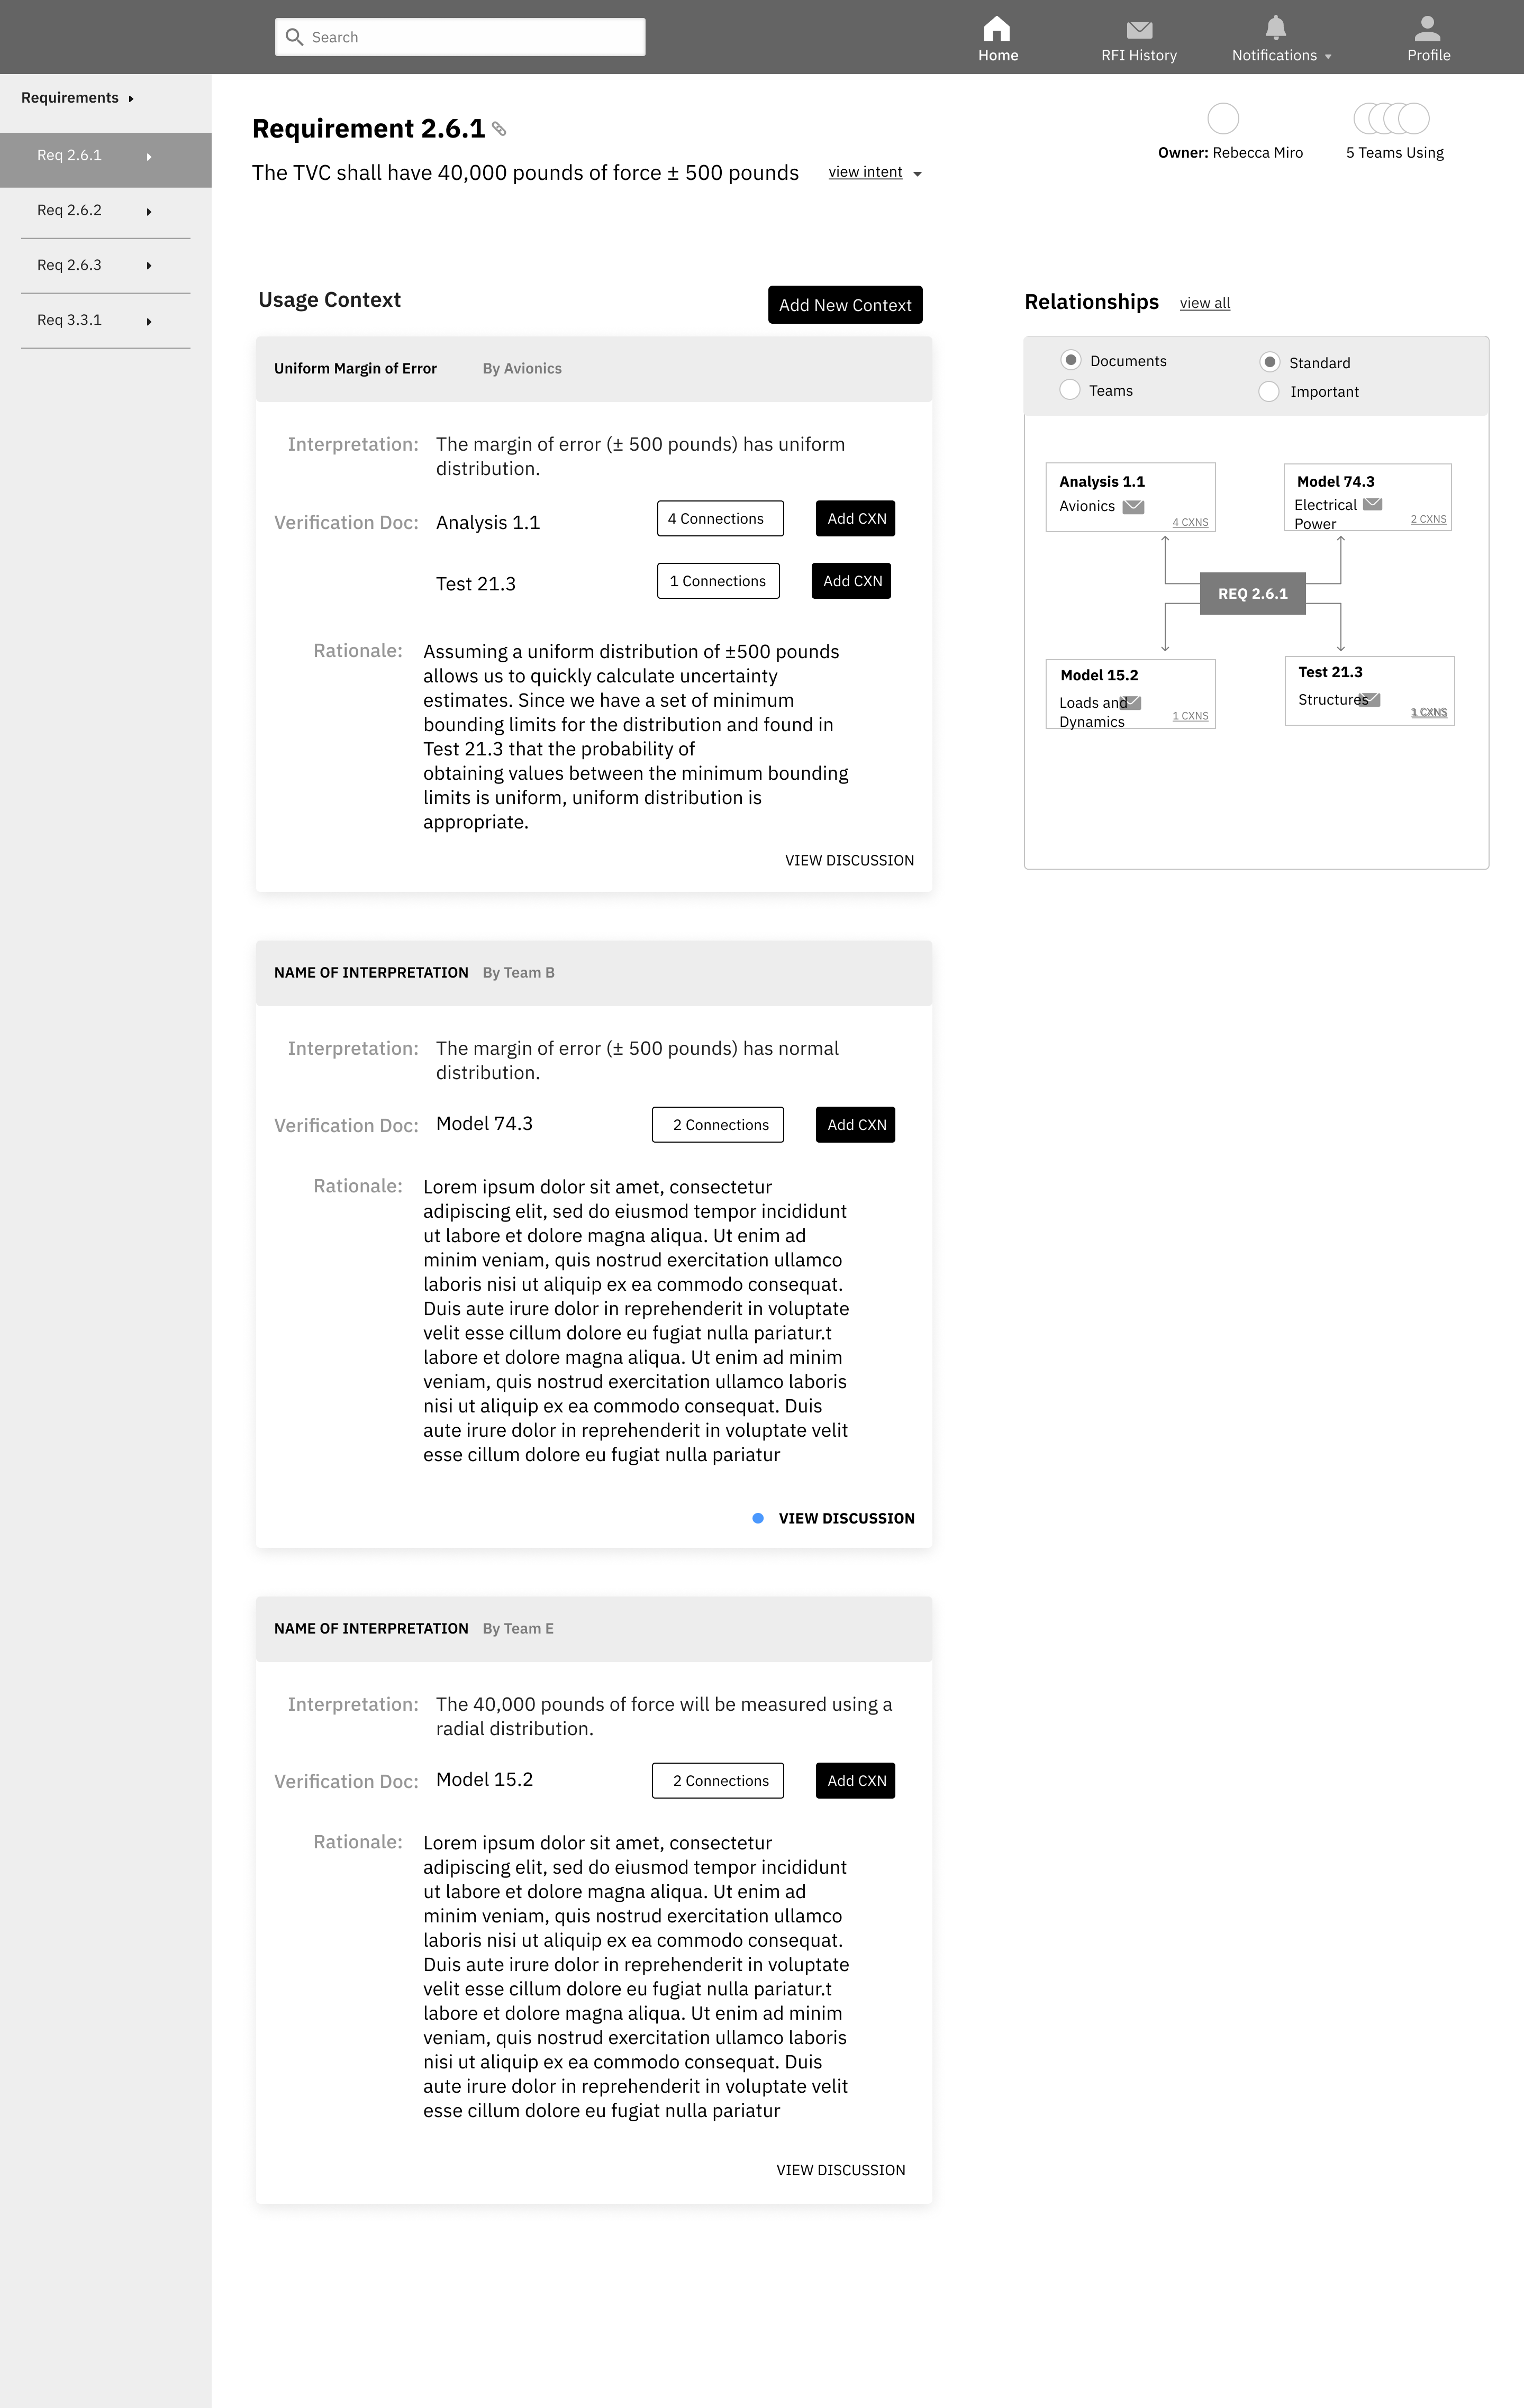
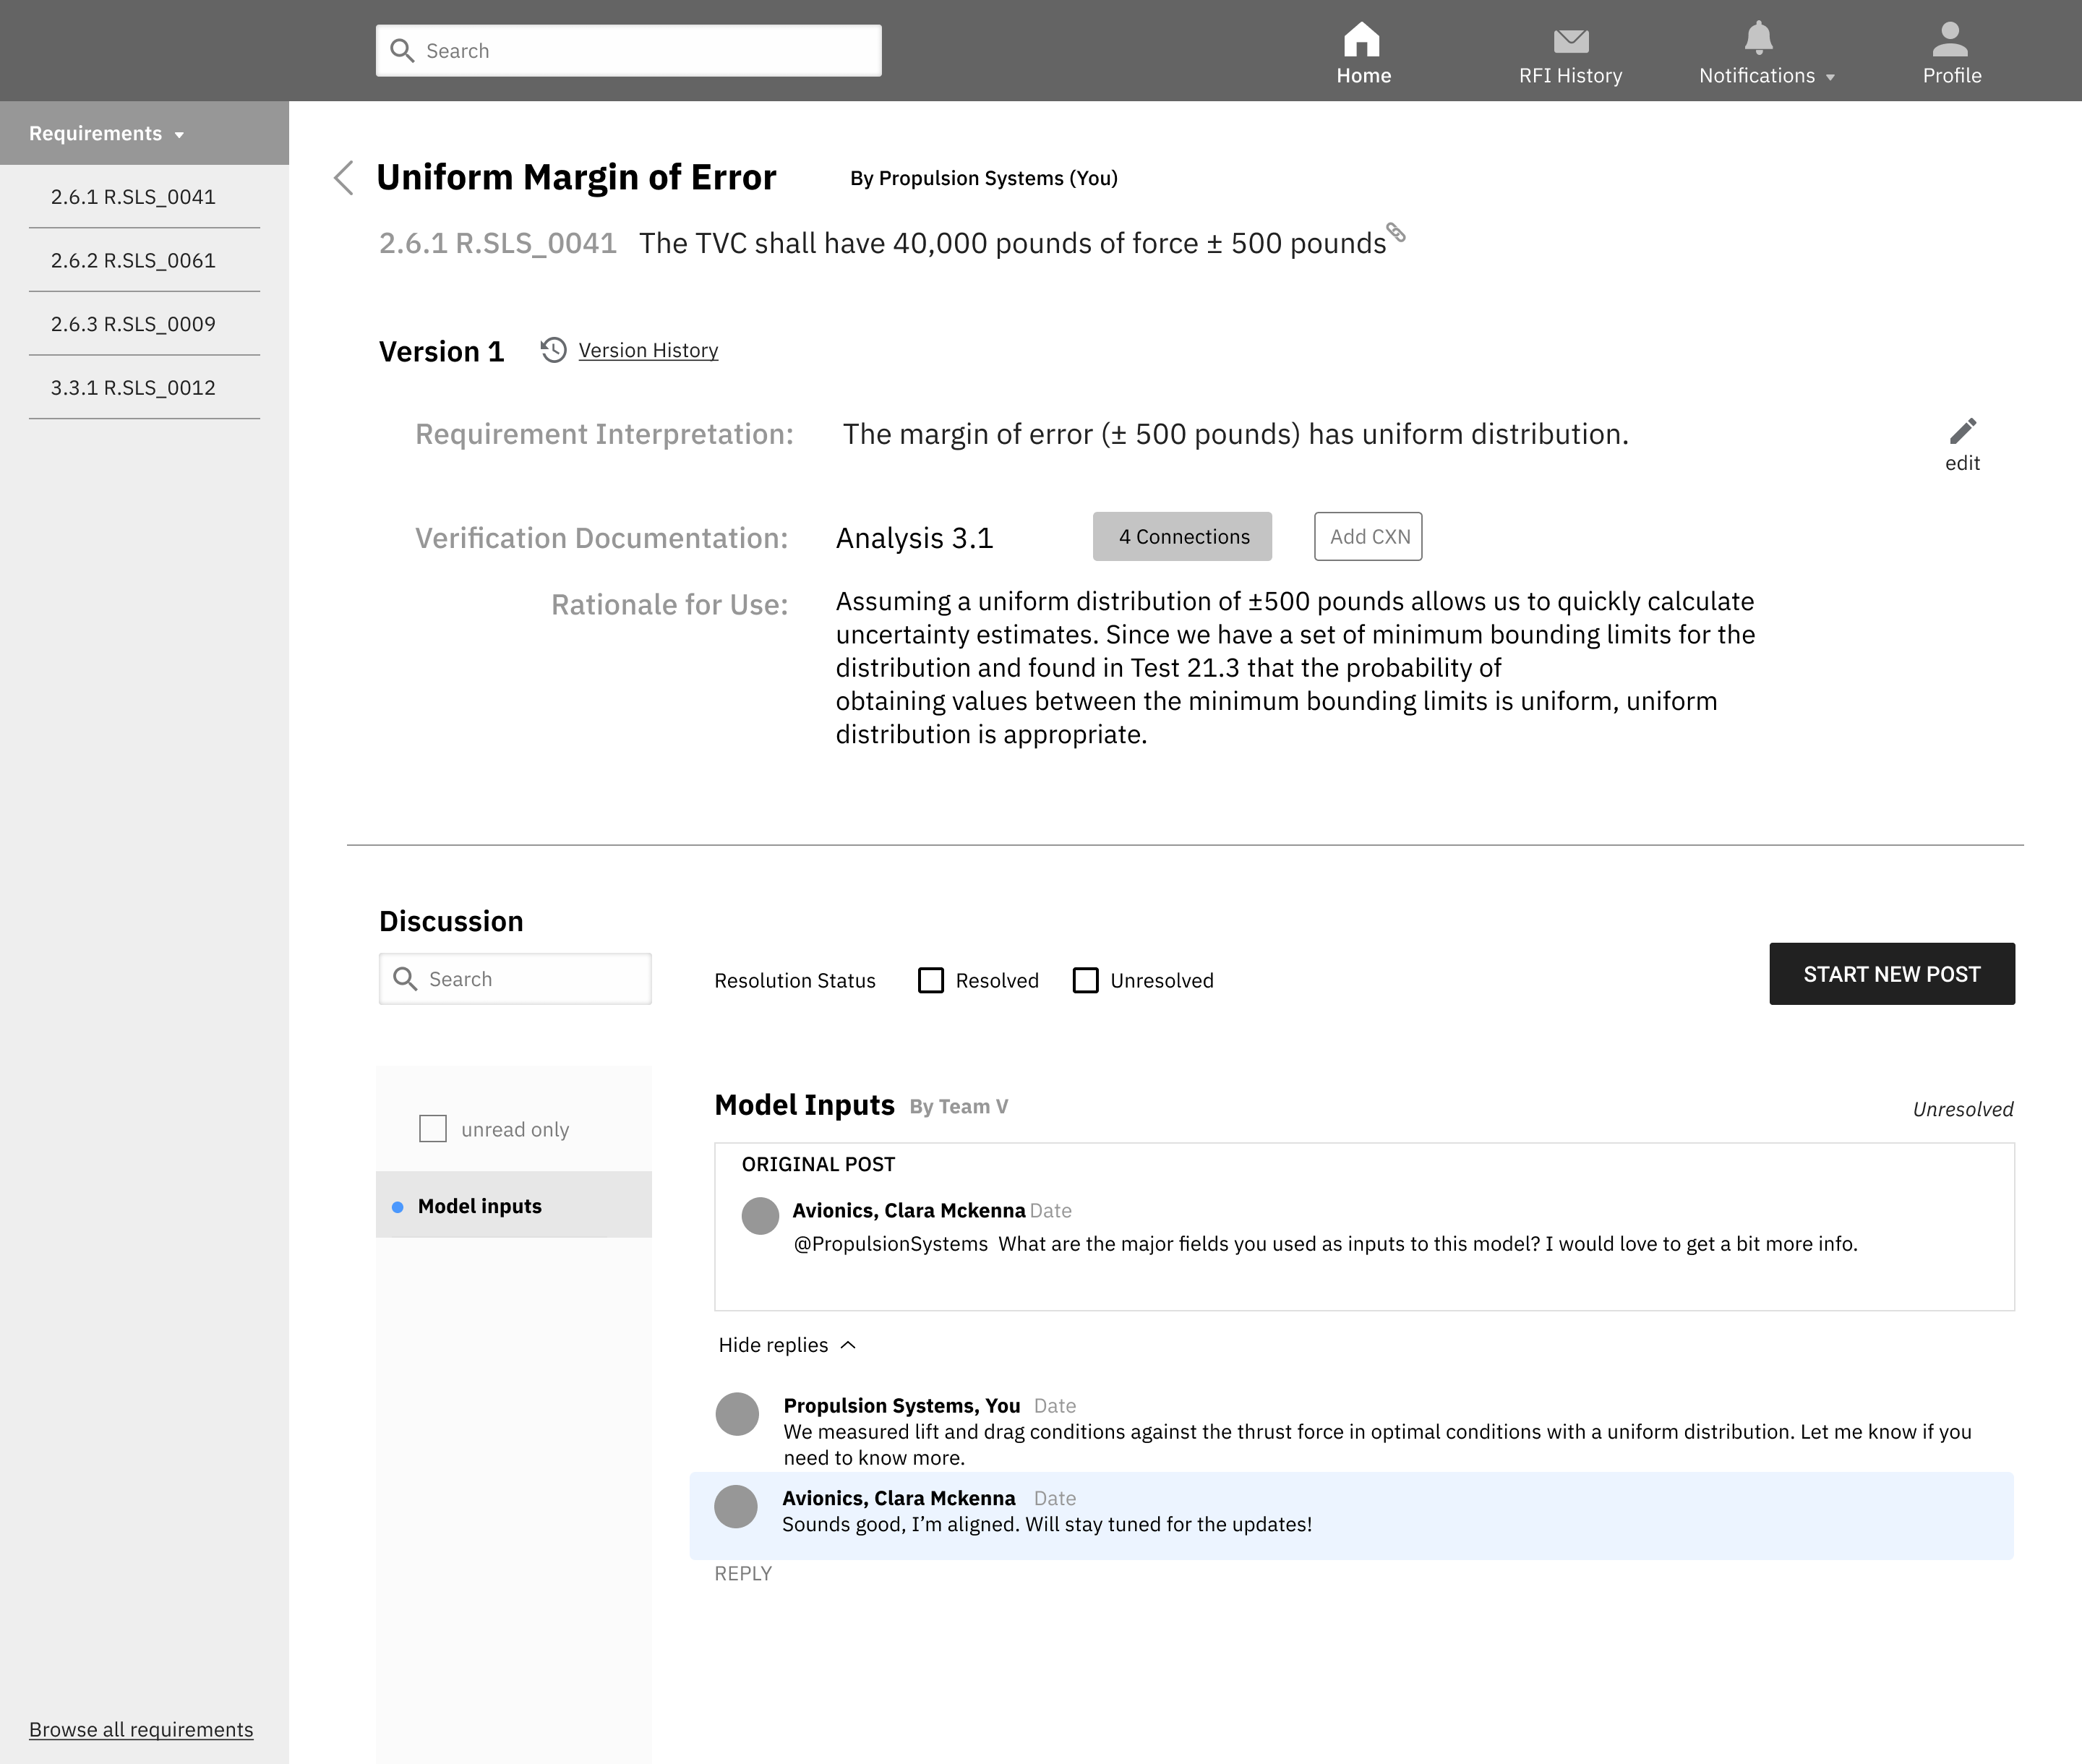
Specific Requirement
Requirement details, such as usage contexts, as surfaced for users. Teams do not necessarily have to agree on one “correct” usage context, but an understanding of other teams’ interpretations, verification activities, and rationales helps catch discrepancies early.
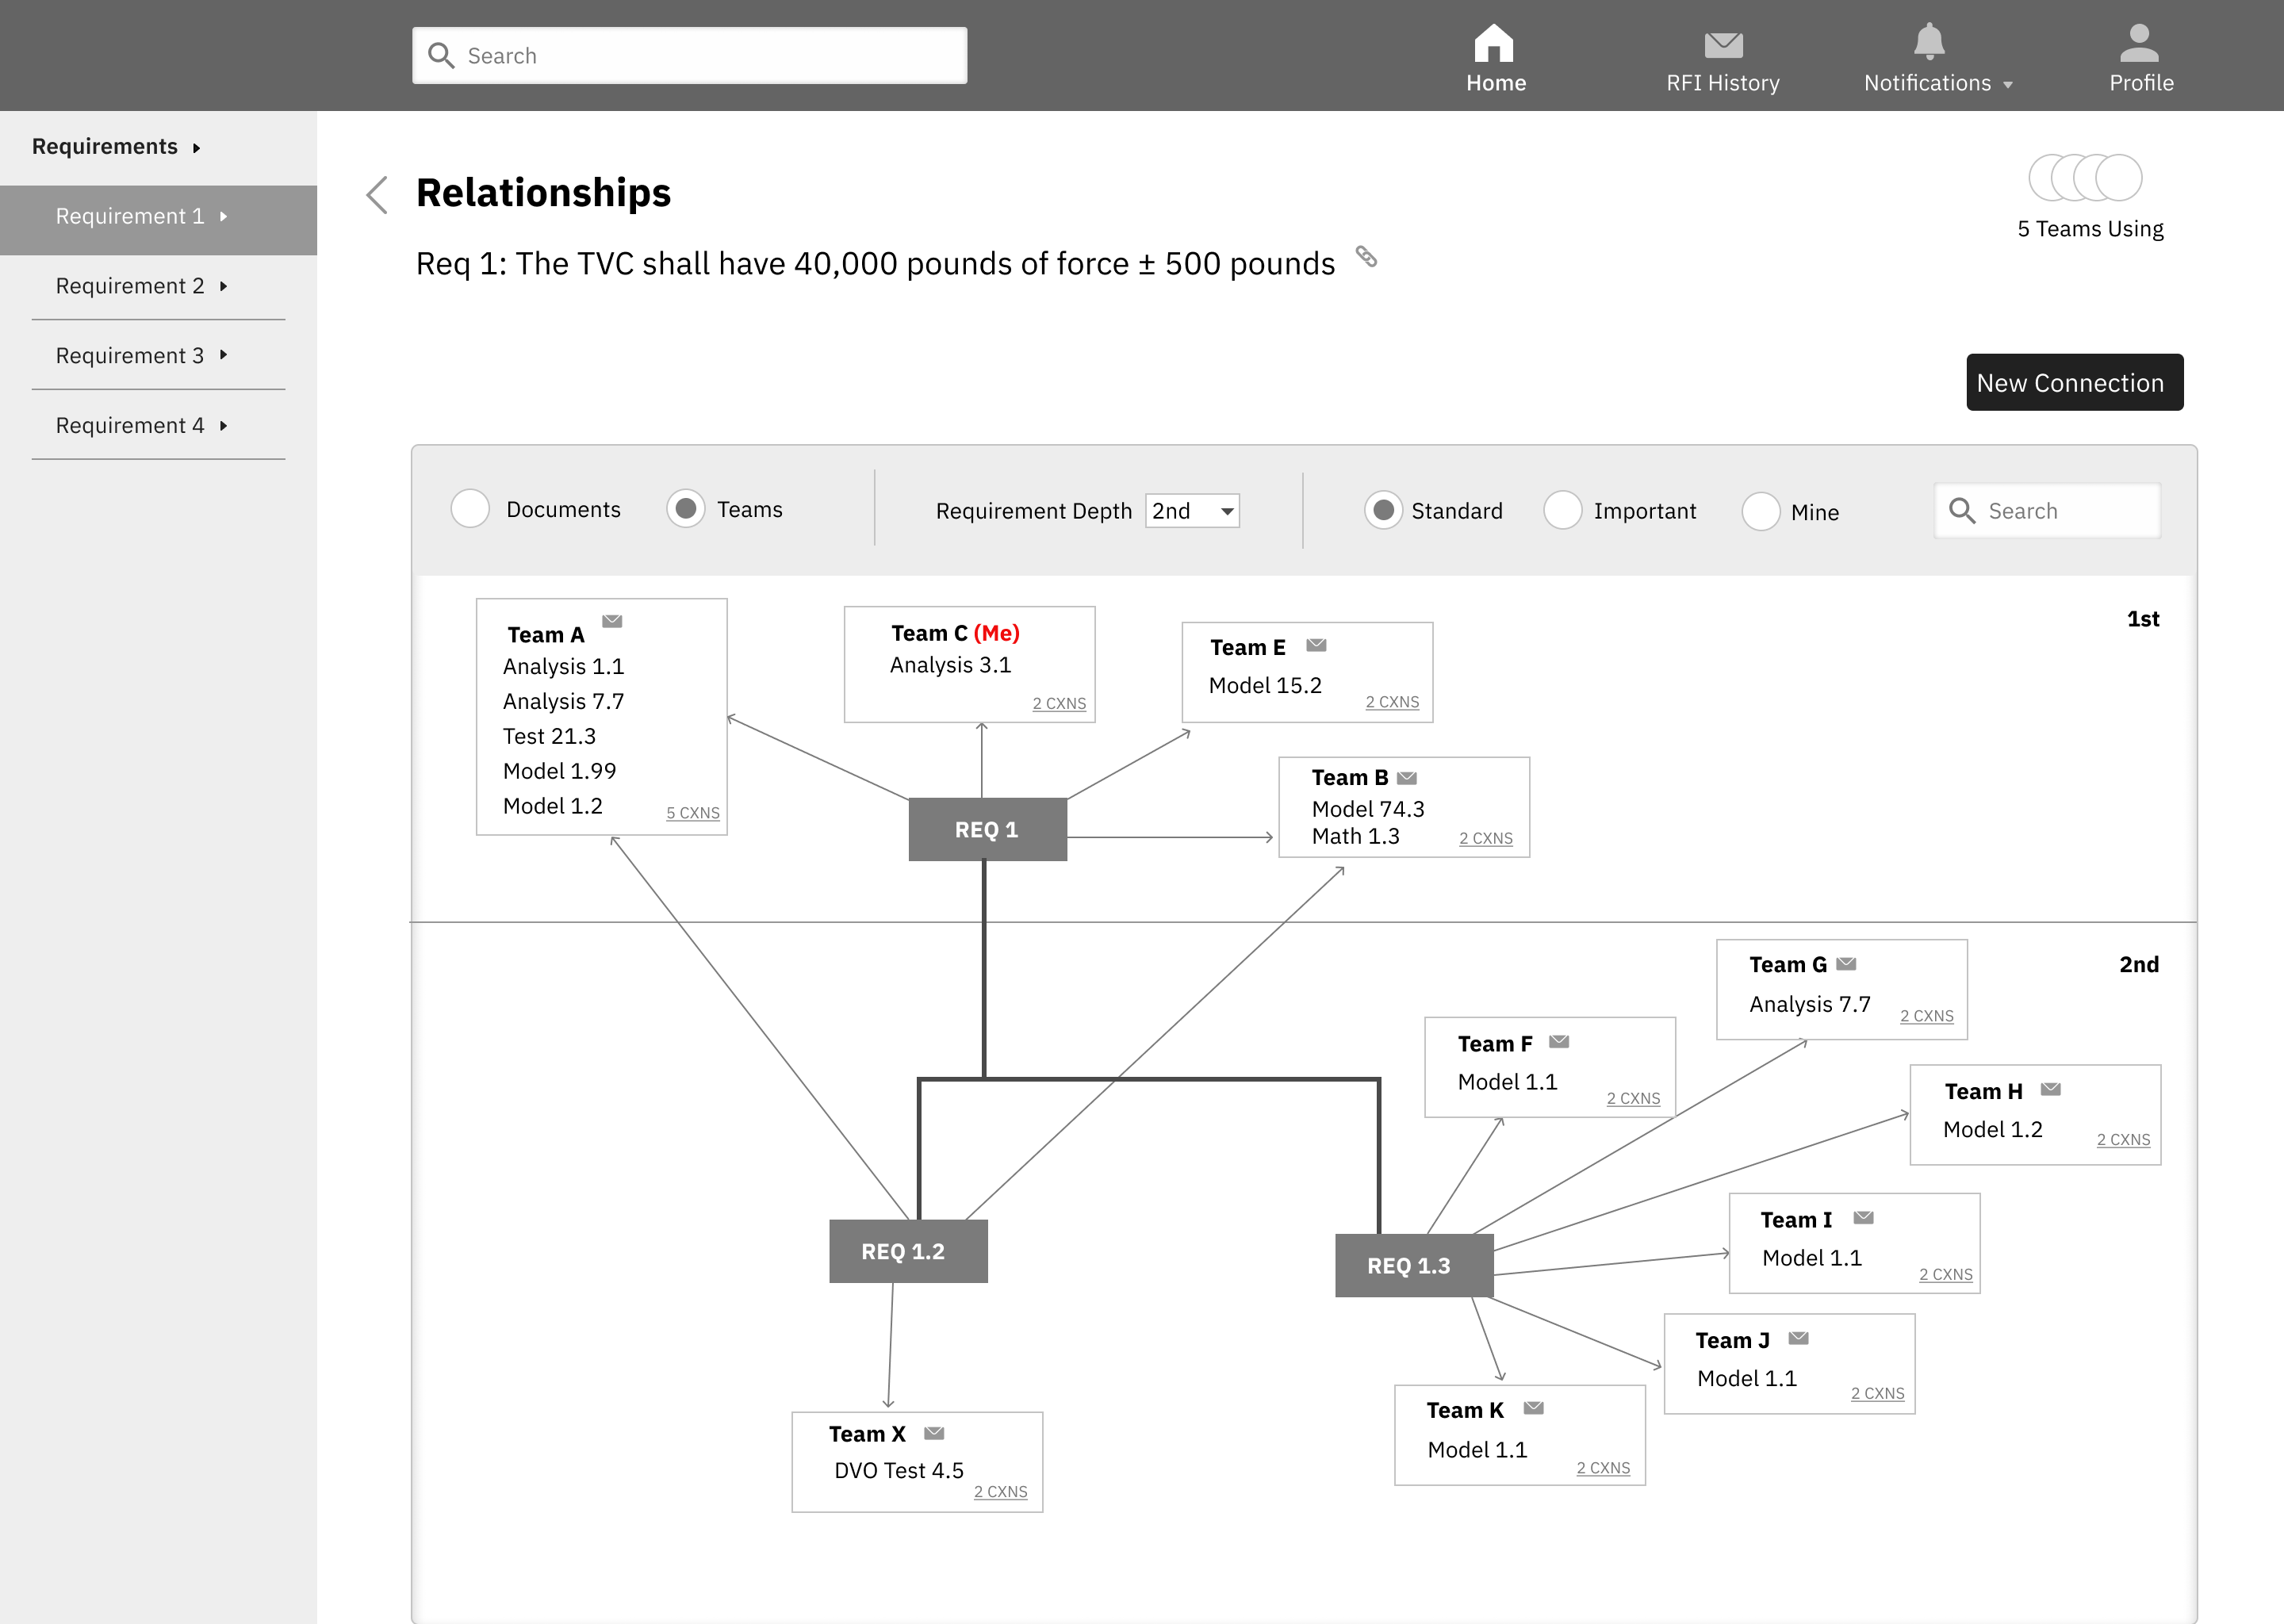
Relationship Model
This model helps engineers understand dependencies by offering visibility into the greater ecosystem of requirements, teams, and documents.
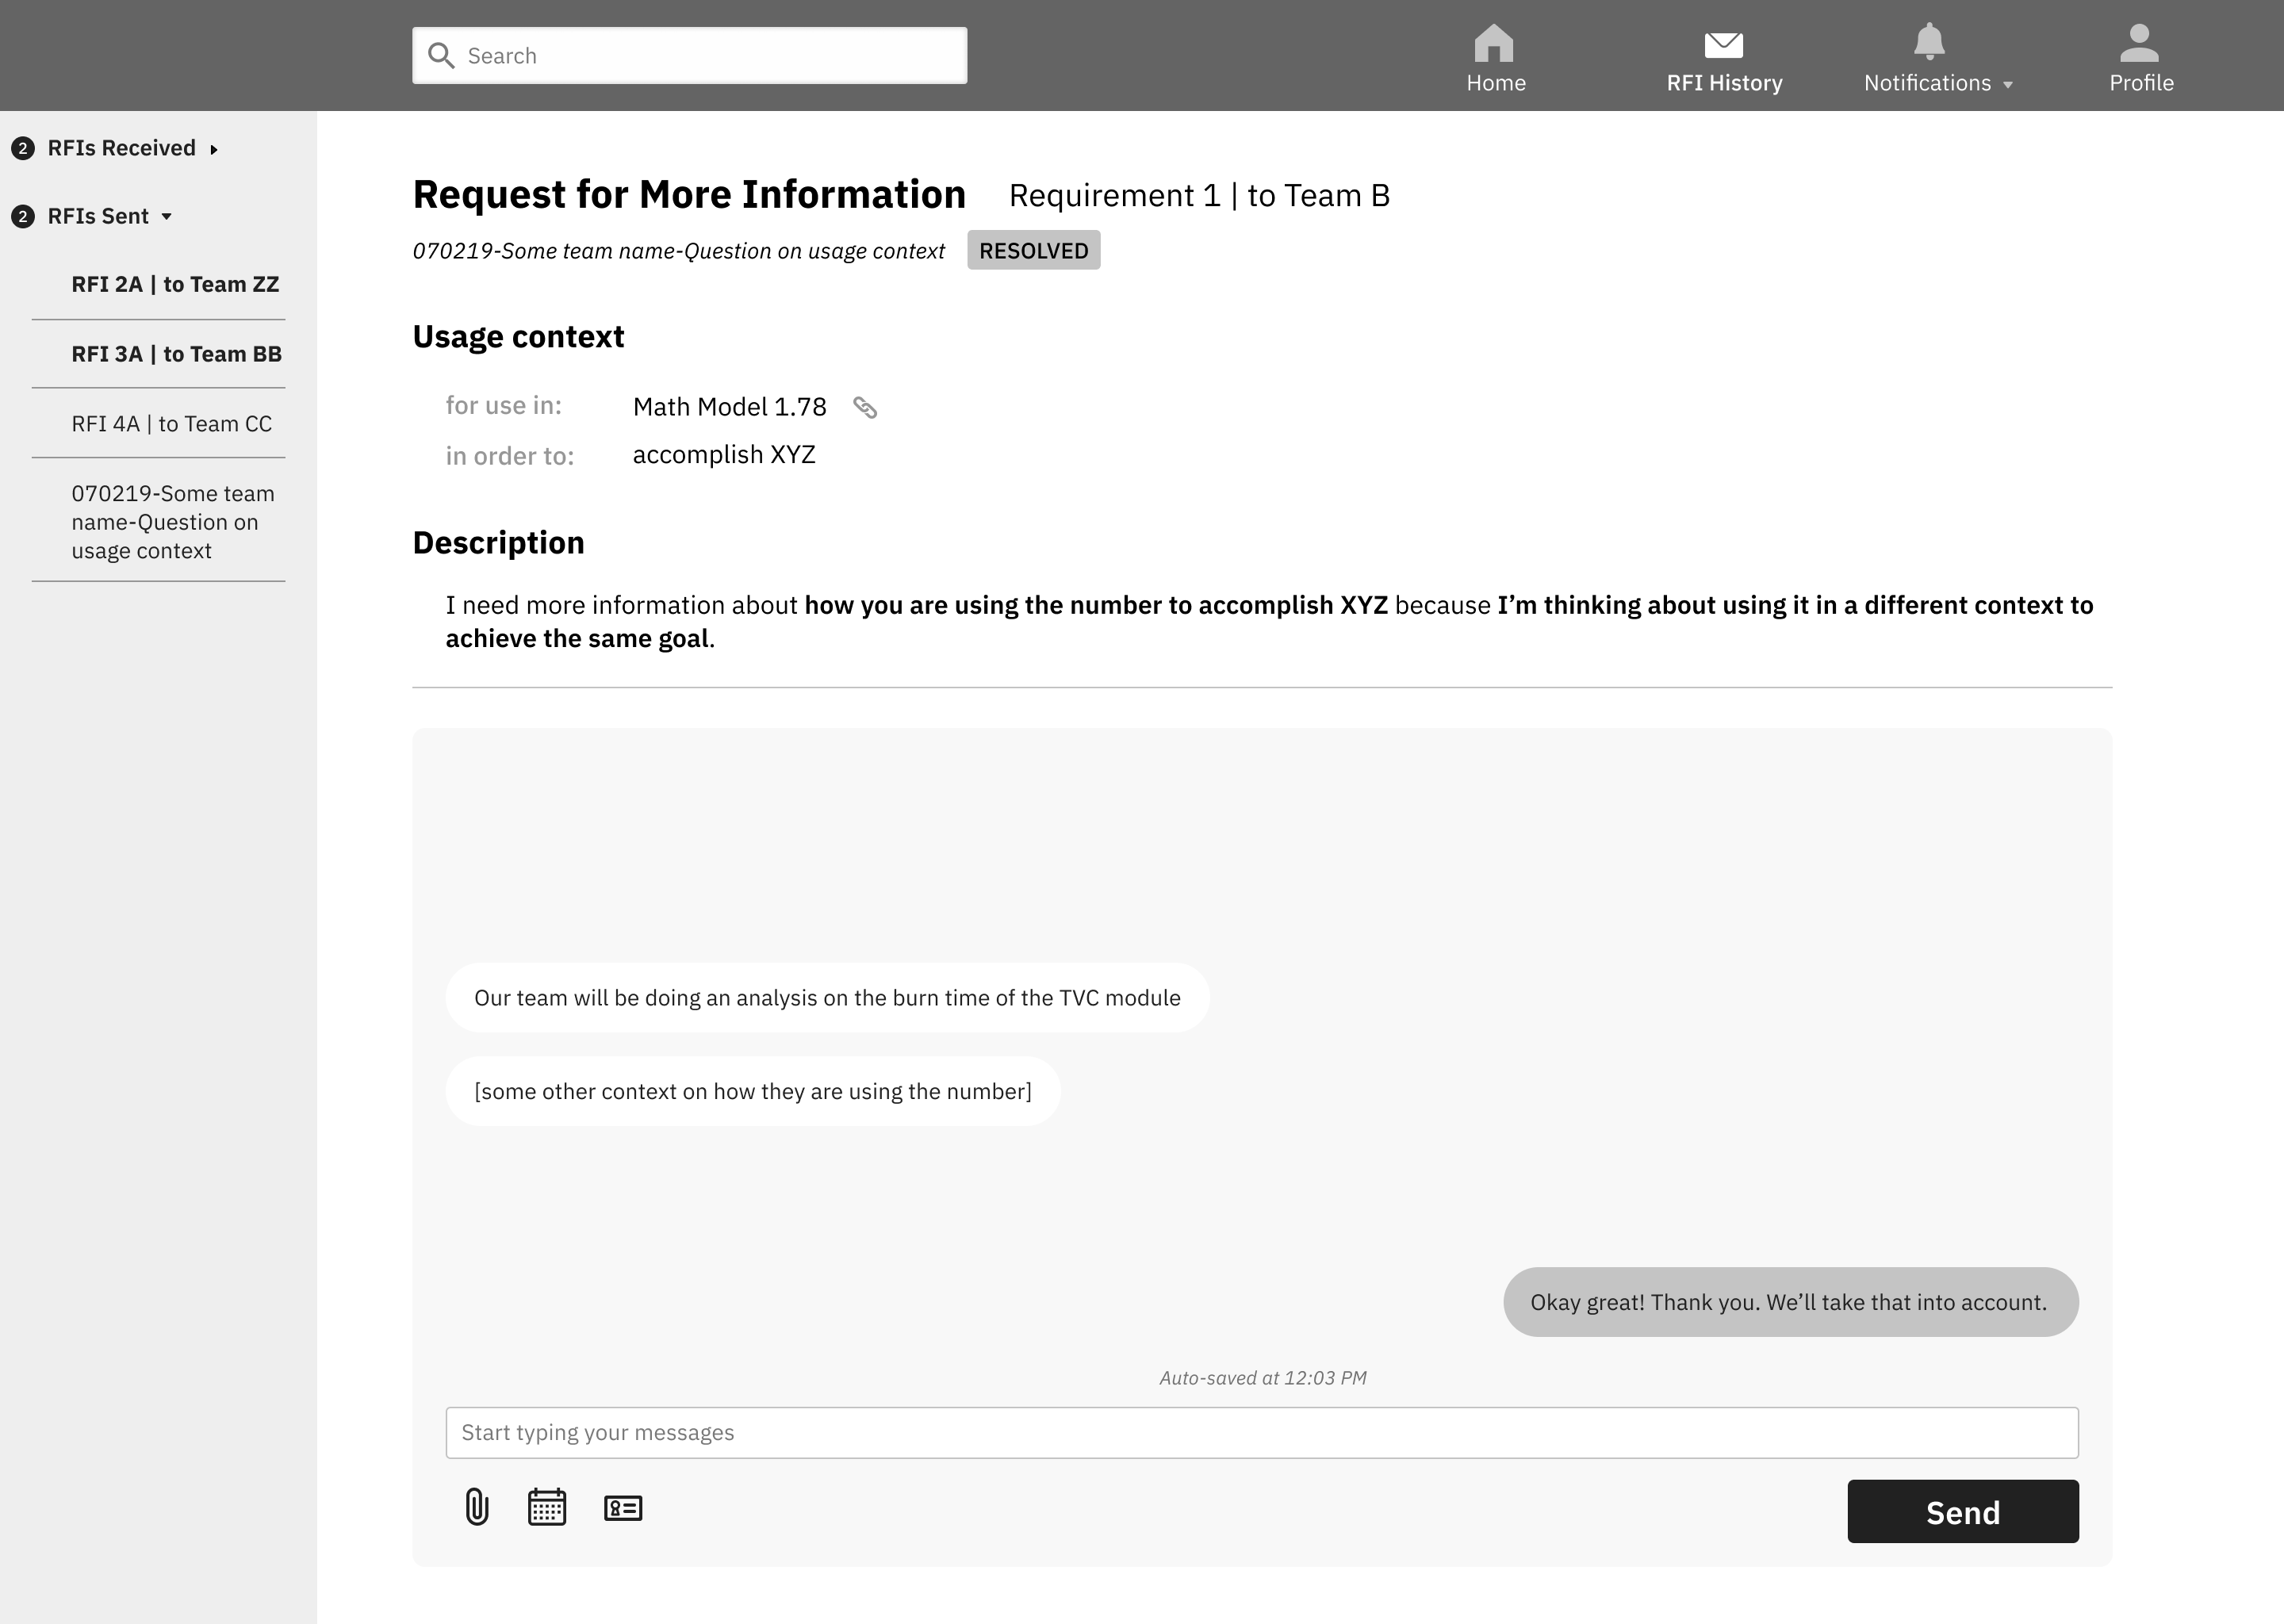
Request for Info (RFI)
The Request for Information (RFI) function complements the public discussion with a space for private and elaborate conversations.
In-context Discussions
This function contains the communication in tool so decision-making is documented and can be easily referenced.
We tested our mid-fi prototypes with six NASA SLS engineers using a variety of methods - stakeholder walkthroughs, card sorting, and comparison testing. Our key learnings included:
- Although the amount of detail in our solution was appreciated, we need to prioritize and define the most essential information users will be interacting with.
- Engineers repeatedly expressed that it’s important for engineers to be able to trace back to records of past decisions. This inspired us to think about ways to document the decision points.
- Engineers wanted to know that relevant parties have taken actions to address their input, and we continued to brainstorm mechanism to close the loop.
Moving up to high-fidelity with usability testing
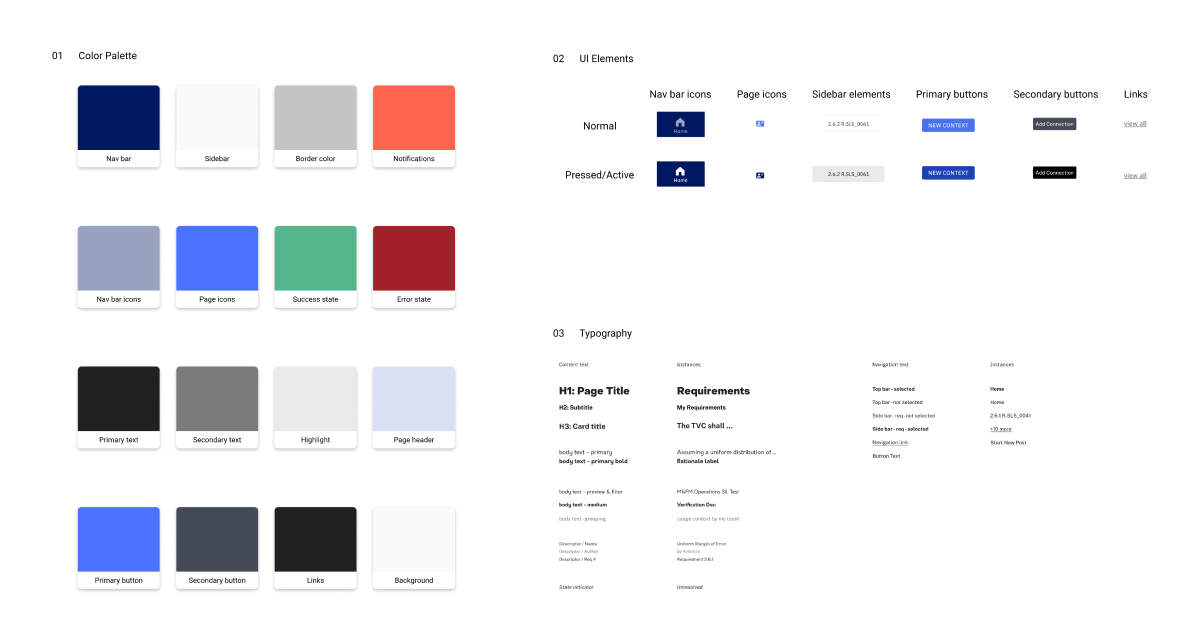
Design System
After finalizing the structure and content for our prototype, the designers on our team sat down to do an audit of the elements across all the screens. When defining the color palette, we referenced the NASA brand, but wanted to differentiate it from the existing softwares. Building a design system allowed us to work simultaneously to bring up the fidelity in our prototype while maintaining visual consistency.
Evaluating our Solution
To assess the success of our product designs, we conducted usability and usefulness tests at key points throughout our design process. During our first series of tests, we learned from participants that we needed to focus and improve the consistency and clarity of our terminology, created better affordance for our calls to action, and concentrate on a narrow set of high-impact features.
Following system walkthroughs, our stakeholders gave our solution a 4.1 out of 5 when assessing its likely effectiveness at aligning discipline engineers and a 5 out of 5 when discussing if they themselves would use our system to get on the same page with their colleagues.
With the information hierarchy defined, we conducted a series of scenario-based think aloud tests. Our testers had a 93.1 percent success rate in completing assigned tasks. Further, we measured the perceived difficulty on completing the task on a scale of 1-7 (1 being the easiest and 7 being the most difficult), yielding an average score of 2.73. Considering we did not design our system to be walk up and use (given it’s unique set of stakeholders and workplace integration) and this is well within our predefined range of acceptability, we’re very confident in the usability of our solution.
Looking forward, we would like to run a pilot of our system with a group of Marshall Space Flight Center discipline teams to see the solution in practice and collect comparison statistics on schedule delays and requirement rework.