Data Visualization
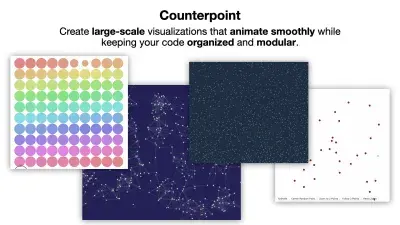
Visualization leverages human perception to analyze potentially large amounts of data and make it easier for us to understand.
Using graphical or visual formats to represent data, such as charts, graphs, maps and dashboards, enables us to make complex data more accessible. It can help in identifying patterns, trends, and insights that might not be immediately apparent from raw data. Relatedly, computational data science techniques contribute to data visualization as well. Machine learning models and their applications allow data scientists to analyze large amounts of complex data, but our focus on human-centered data science pairs the people with domain expertise along with the computer’s capabilities.
The CMU Data Interaction Group develops new languages and tools for analysis and communication.
Students who want to learn more about this HCI research area might be interested in the following courses:
-

CMU at CHI 2026
NEWSThis year, authors from CMU contributed to 76 papers accepted to CHI, including 12 award-winning papers. “The interdisciplinary CHI confer...
-

DIG Lab at VIS 2025
NEWSDIG Lab authors contributed to five papers at VIS 2025 and Dominik Moritz was recognized with a 10-year test of time award for the Voyager...
-

Voyager Paper Earns InfoVis Test of Time Award
NEWSA foundational research paper that changed how people explore data has been recognized for its long-term impact, a decade after its public...
-
DIG Lab at VIS 2024
NEWSThe Data Interaction Group (DIG) Lab at Carnegie Mellon University was well represented at IEEE VIS 2024, the premier forum for advances i...
-

CMU at CHI 2025
NEWSOur halls are abuzz with talk of “CHI” (pronounced “kai”), the nickname for the upcoming conference on computer human interaction (CHI). ...
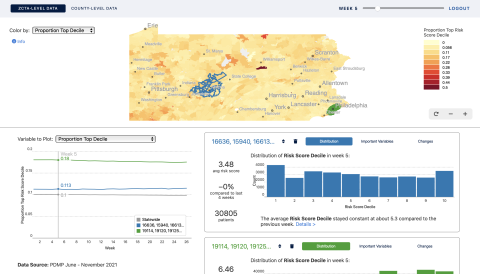
Predicting and Visualizing Overdose Risk for Public Health
PROJECTOverdose due to opioid misuse and abuse is currently a critical public health issue in the United States and worldwide. Machine learning (ML) approaches h...
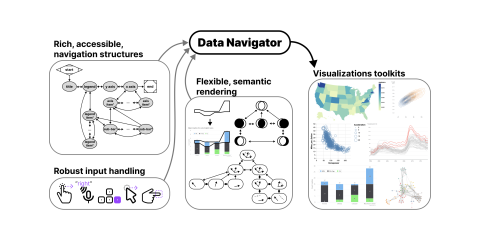
Data Navigator
PROJECTData Navigator is a JavaScript library that allows for navigation of data structures. Data Navigator makes png, svg, canvas, and even webgl graphics acces...
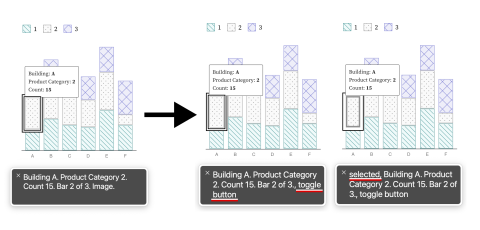
Chartability
PROJECTChartability is a set of heuristics (testable questions) for ensuring that data visualizations, systems, and interfaces are accessible. Chartability is or...
-
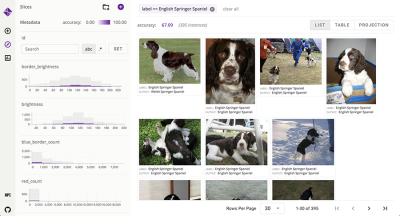
CMU Researchers Release Zeno for Machine Learning Model Evaluation
NEWSA team of Carnegie Mellon University researchers has released a new interactive platform for data management and machine learning (ML) eva...