Faculty

What Makes Digital Support Effective?
PROJECTOnline mental health support communities have grown in recent years for providing accessible mental and emotional health support through volunteer counsel...

Shaping Online Dialogue
PROJECTCommunity rules play a key part in enabling or constraining the behaviors of members in online communities. However, little is unknown regarding whether a...
Matching for Peer Support
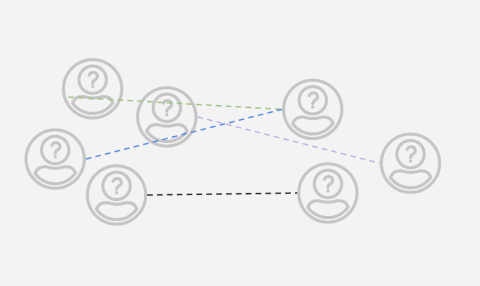
PROJECTOnline mental health communities (OMHCs) have emerged in recent years as an effective and accessible way to obtain peer support, filling crucial gaps of t...

Eye into AI
PROJECTRecent developments in explainable AI (XAI) aim to improve the transparency of black-box models. However, empir...
Predicting and Visualizing Overdose Risk for Public Health
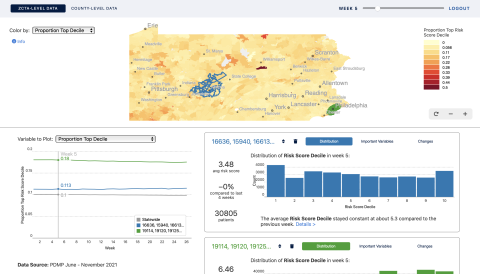
PROJECTOverdose due to opioid misuse and abuse is currently a critical public health issue in the United States and worldwide. Machine learning (ML) approaches h...

Enhance Project
PROJECTIn the Enhance Project, learning scientists collaborate with education agencies to improve how states assess their students. Drawing upon the fields of le...

Learning Analytics and Data Sharing
PROJECTLearnSphere is a community data infrastructure to support learning improvement online. It integrates educational data and analysis repositories to offer ...
Mixed-Reality For Science Learning
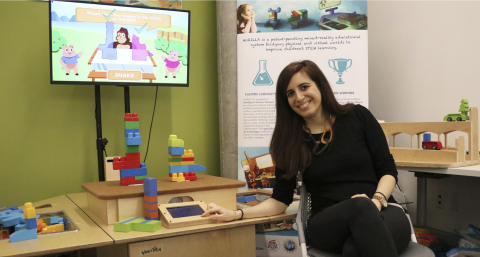
PROJECTNoRILLA is a patented mixed-reality educational system bridging physical and virtual worlds to improve STEM learning. Research at Carnegie Mellon Universi...
Multiplier Effects in Math Education (MEME) Project
PROJECTThe MEME Project’s goal is to produce better educational outcomes by increasing motivation, learning, and self-regulation....

Personalized Learning Squared (PLUS)
PROJECTThe PLUS project is improving the learning outcomes for marginalized students by "squaring" the power of both human and computer tutoring. The PLUS Traini...
RealityReplay
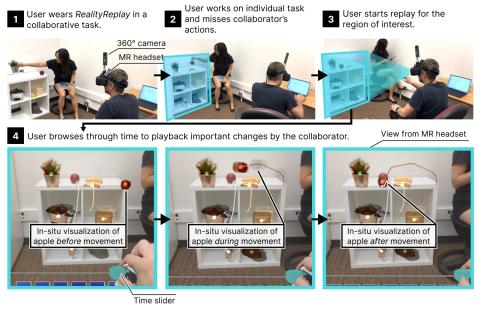
PROJECTHumans easily miss events in their surroundings due to limited short-term memory and field of view. This happens, for example, while watching an instructo...
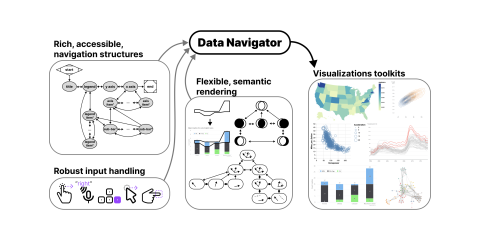
Data Navigator
PROJECTData Navigator is a JavaScript library that allows for navigation of data structures. Data Navigator makes png, svg, canvas, and even webgl graphics acces...

